
Figure 6—figure supplement 1.
- ID
- ZDB-FIG-240211-41
- Publication
- Knabl et al., 2024 - Analysis of SMAD1/5 target genes in a sea anemone reveals ZSWIM4-6 as a novel BMP signaling modulator
- Other Figures
-
- Figure 1—figure supplement 1.
- Figure 1—figure supplement 1.
- Figure 1—figure supplement 2.
- Figure 2.
- Figure 3.
- Figure 4.
- Figure 5—figure supplement 1—source data 1.
- Figure 5—figure supplement 1—source data 1.
- Figure 6—figure supplement 1.
- Figure 6—figure supplement 1.
- Figure 6—figure supplement 2—source data 1.
- Figure 6—figure supplement 3—source data 1.
- Figure 6—figure supplement 4.
- Figure 6—figure supplement 5.
- All Figure Page
- Back to All Figure Page
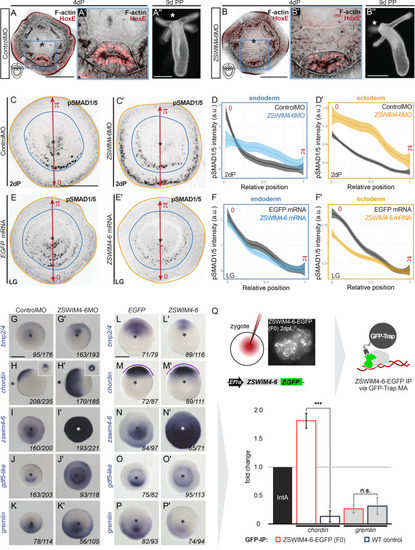
ZSWIM4-6 is a modulator of BMP signaling that appears to act as transcriptional repressor. (A–B’’) Morpholino knockdown (KD) of zswim4-6 results in patterning defects. (A) and (B) show confocal sections across the pharyngeal region of 4d planulae stained with antiHoxE antibody (Genikhovich et al., 2015) and phalloidin. (A’) and (B’) show the areas boxed in (A) and (B). White dotted lines delineate mesenterial chambers. In the 4d planula, the HoxE-positive mesenterial chamber does not reach the pharynx, which leads to the fusion of neighboring chambers (compare A, A’ with B, B’). This results in the formation of three instead of four tentacles in the 9d polyp (compare A’’ with B’’). (C–F’) Immunofluorescence and quantification of relative nuclear anti-pSMAD1/5 staining intensities in 2d ZSWIM4-6 morphants (C–D’) and upon zswim4-6 mRNA overexpression in the late gastrula (E–F’). Intensity measurements (arbitrary units, a.u.) are plotted as a function of the relative position of each nucleus in the endoderm or in the ectoderm along a 180° arc from 0 (high signaling side) to π (low signaling side). The measurements from Control MO embryos (n = 10) and ZSWIM4-6MO embryos (n = 10), as well as egfp mRNA embryos (n = 22 for the endodermal, and n = 24 for the ectodermal measurements) and zswim4-6 mRNA embryos (n = 8 for the endodermal, and n = 9 for the ectodermal measurements) are described by a LOESS smoothed curve (solid line) with a 99% confidence interval for the mean (shade). For visualization purposes, the intensity values were normalized to the upper quantile value among all replicates and conditions of each control-experiment pair. (G–K’) Expression of zswim4-6 and BMP network components in the 2d planula upon morpholino KD of zswim4-6; All images except for (H) and (H’) show oral views. (L–P’) Expression of zswim4-6 and BMP network components in late gastrula (30 hr) upon zswim4-6 mRNA injection; oral views, purple dashed line marks the loss of a sharp boundary of chd expression. In (A–P’), asterisks mark the oral side. In (A-P’), scale bars 100 µm. (Q) ChIP with GFP-Trap detects ZSWIM4-6-EGFP fusion protein in the vicinity of the pSMAD1/5 binding site in the upstream regulatory region of chordin but not of gremlin. Experiment on biological quadruplicates. Mean enrichments and standard deviations are shown. |