
FIGURE
Figure 1—figure supplement 1.
- ID
- ZDB-FIG-240211-33
- Publication
- Knabl et al., 2024 - Analysis of SMAD1/5 target genes in a sea anemone reveals ZSWIM4-6 as a novel BMP signaling modulator
- Other Figures
-
- Figure 1—figure supplement 1.
- Figure 1—figure supplement 1.
- Figure 1—figure supplement 2.
- Figure 2.
- Figure 3.
- Figure 4.
- Figure 5—figure supplement 1—source data 1.
- Figure 5—figure supplement 1—source data 1.
- Figure 6—figure supplement 1.
- Figure 6—figure supplement 1.
- Figure 6—figure supplement 2—source data 1.
- Figure 6—figure supplement 3—source data 1.
- Figure 6—figure supplement 4.
- Figure 6—figure supplement 5.
- All Figure Page
- Back to All Figure Page
Figure 1—figure supplement 1.
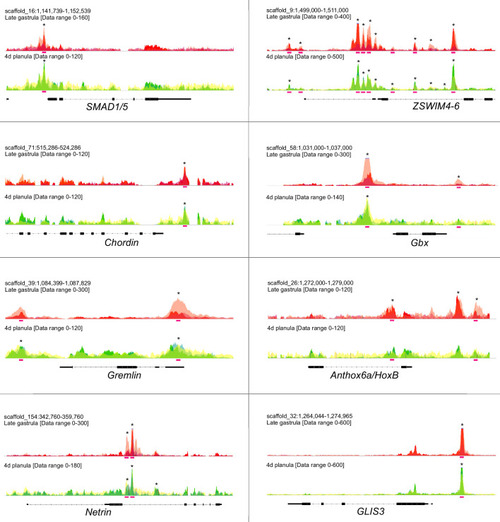
Sequencing coverage profile shows the enrichment of pSMAD1/5 binding at the target genes. Overlays of the three biological replicates are shown. Statistically significant peaks are marked with asterisks. Pink bars, BMP response elements (BREs). |
Expression Data
Expression Detail
Antibody Labeling
Phenotype Data
Phenotype Detail
Acknowledgments
This image is the copyrighted work of the attributed author or publisher, and
ZFIN has permission only to display this image to its users.
Additional permissions should be obtained from the applicable author or publisher of the image.
Full text @ Elife