Fig. 2
- ID
- ZDB-FIG-240112-62
- Publication
- Zhong et al., 2023 - The microbiota regulates hematopoietic stem and progenitor cell development by mediating inflammatory signals in the niche
- Other Figures
- All Figure Page
- Back to All Figure Page
|
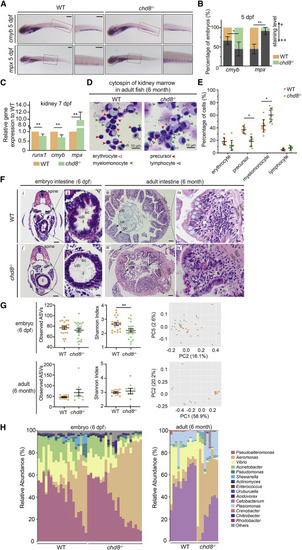
chd8−/− zebrafish display inhibited HSPC formation, impaired intestinal structure, and altered microbiota in larva and adults (A) WISH for cmyb and mpx in the CHT in WT and chd8−/− fish at 5 dpf. (B) Quantification of WISH results from (A). Scale bars, 200 μm. (C) qPCR analysis for runx1, cmyb and mpx expression in the kidneys of WT and chd8−/− fish at 7 dpf. (D) May-Grunwald-Giemsa staining of the whole kidney marrow cells obtained from 6-month-old WT and chd8−/− fish. Open red arrows indicate erythroid cells. Red arrows indicate precursors. Green arrows indicate myelomonocytes. Open black arrows indicate lymphoid cells. (E) The statistical analysis for blood cell counts, n = 6 in WT and n = 5 in chd8−/−. (F) Representative images of intestinal cross-sections of WT and chd8−/− larval and adult fish, stained with hematoxylin and eosin. ec, enterocytes; il, intestinal lumen; ce, columnar epithelium; gc, goblet cells,; lsm, longitudinal smooth muscle layer; csm, circular smooth muscle layer. Scale bars, 50 μm (i, i’, iii, and iii’) and 10 μm (ii, ii’ iv, and iv’). (G) The analysis of alpha diversity for microbiota in WT and chd8−/− larvae and adults. The PCoA plots based on Bray-Curtis distance for the microbial structure of WT and chd8−/− larvae (p = 0.007, PERMANOVA test based on Bray-Curtis distance) and adults (p = 0.001, PERMANOVA test based on Bray-Curtis distance). Orange, WT; green, chd8−/−. (H) Relative abundance of the main genera of microbiota in WT and chd8−/− larvae and adults. n = 20 in WT and n = 22 in chd8−/ larvae; n = 11 in WT and n = 9 in chd8−/ adults. In (B), (C), and (E), Student’s t tests; mean ± SEM of three independent experiments (B and C) or of all samples (G), n = 45–60 larvae in each group for WISH, n = 30–40 larvae per group for qPCR, ∗p < 0.05, ∗∗p < 0.01; ns, not significant. See also Figure S3. |

