FIGURE

Figure 2

ID
ZDB-FIG-240112-43
Publication
Raman et al., 2023 - A Zebrafish Mutant in the Extracellular Matrix Protein Gene efemp1 as a Model for Spinal Osteoarthritis
Other Figures
All Figure Page
Back to All Figure Page
Figure 2

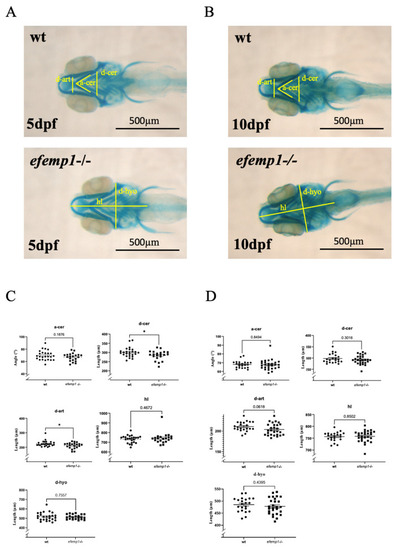
Cartilage staining with alcian blue of 5 dpf (A,C) and 10 dpf (B,D) wt and efemp1−/− mutant larvae. The different measures are illustrated in (A,B): d-ar: distance between the Meckel’s-palatoquadrate articulations; d-cer: distance between the posterior ends of the ceratohyals; a-cer: angle between the ceratohyals; hl: head length and d-hyo: head width. (C) efemp1−/− reveal a reduced distance between the articulation (d-ar) and narrower distance between the ceratohyal elements (d-cer) at 5 dpf compared to wt (wt n = 24, efemp1−/− n =21). (D) No difference in the cartilage elements in efemp1−/− at 10dpf compared to wt (wt n = 22, efemp1−/− n = 27). The graphs show the individual data points, the mean value ± SEM; significance: * p < 0.05 (unpaired student’s t-test).

Expression Data

Expression Detail
Antibody Labeling
Phenotype Data
Fish:
Observed In:
Stage Range: Day 5 to Days 7-13

Phenotype Detail
Acknowledgments
This image is the copyrighted work of the attributed author or publisher, and ZFIN has permission only to display this image to its users. Additional permissions should be obtained from the applicable author or publisher of the image. Full text @ Animals (Basel)