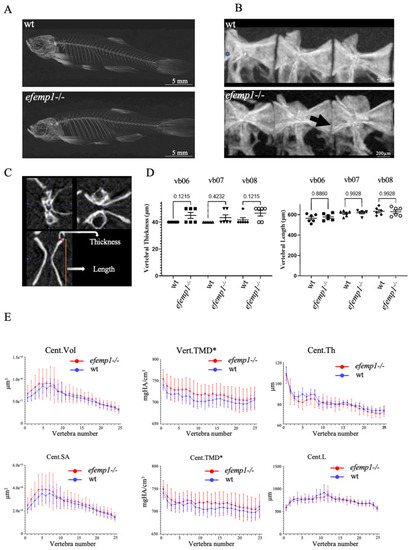
Increased TMD in efemp1−/− mutants. (A) Representative µCT scans (MIPi = Maximum Intensity Projected image) of a 1.5-year-old wt (top) and efemp1−/− (bottom) adult. (B) Lateral view of pre-caudal vertebrae 6–8 (L to R) for the two groups; wt and efemp1−/−. The black arrow points to the decreased intervertebral distance and ruffled border. (C) Representative µCT scan of a vertebra in three planar views, showing the two morphometric measurements: vertebral thickness (µm) and vertebral length (µm). (D) Morphometric analysis comparing vertebral thickness and vertebral length of individual precaudal vertebral body numbers 6–8 (n = 6 fish/group) in efemp1−/− compared to wt. The values are expressed as mean ± SEM (standard error on mean), statistical significance as determined with ordinary one-way ANOVA test. (E) Line plots generated using the GraphPad Prism9 Software (v.9.4.1) of the data points obtained from the FishCuT Software revealing significantly increased TMDs in the entire vertebrae (Vert.TMD) and in the vertebral centra (Cent.TMD) of efemp1−/− adults relative to wt (p < 0.0001), with no significant differences observed in other combinatorial measures, (n = 6 fish/group and total no. of vertebrae analyzed = 25/individual). The values are expressed as mean ± SEM, significance: * p < 0.05, as determined via multiple linear regression analysis.
|
