Fig. 4
- ID
- ZDB-FIG-231220-89
- Publication
- Palsamy et al., 2023 - Microglial depletion after brain injury prolongs inflammation and impairs brain repair, adult neurogenesis and pro-regenerative signaling
- Other Figures
- All Figure Page
- Back to All Figure Page
|
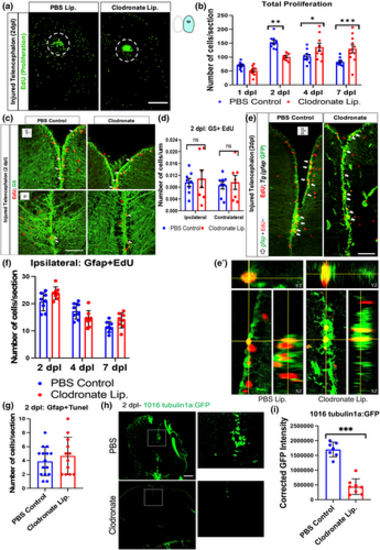
Microglia are dispensable for adult neural stem cell proliferation. (a) EdU labeling of the ipsilesional telencephalon of control or clodronate injected brains at 2 dpl. The dashed circle marks the injury site. The strong green stain at the poke site is non-specific labeling of injured tissue. (b) EdU quantification in the ipsilesional telencephala at 1, 2, 4, and 7 dpl. n = 8/group/timepoint, ***p < .0001; **p < .001; *p < .01, repeated measures ANOVA with Tukey's post-hoc test. (c) Confocal images of Glutamine synthetase (GS) and EdU co-immunolabeling at 2 dpl showing anterior (top row) and more posterior (bottom row) telencephalic regions. The small cartoon insets show the image location in the telencephalon. (d) Quantification of double labeling for GS and EdU in both ipsilesional and contralateral telencephalic hemispheres. (e) Confocal images of gfap-driven GFP reporter and EdU co-labeling of midline telencephala at 2 dpl from clodronate and control liposome-treated fish. Arrows indicate double labeled cells. (e′) Orthogonal views of single optical sections from z-stacks of GFP and EdU labeling for colocalization. (f) Quantification of ipsilesional Gfap/EdU co-labeled cells at 2, 4, and 7 dpl at the ventricular zone revealed no significant differences between groups. (g) Quantification of VZ gfap-driven GFP reporter/TUNEL double-positive cells at 2 dpl showed no significant difference between groups. (h) GFP-labeled images of telencephala from a 1016tuba1a-GFP reporter line at 2 dpl after injection of control or clodronate liposomes. Note the marked reduction of GFP in the clodronate-treated fish. The boxed areas are shown at higher magnification in the right panels. (i) Quantification of relative corrected total cell fluorescence (CTCF) intensity of 1016tuba1a-GFP reporter expression. ***p < .0001. Scale bars = 100 μm in all image panels, and the error bars indicate SEM. |

