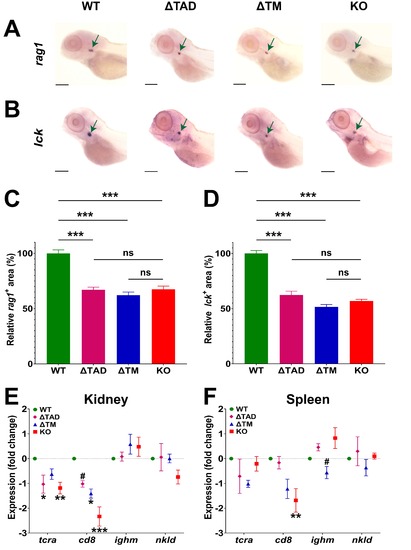
Analysis of lymphopoiesis in Stat5.1 mutants. (A–D) Expression analysis of lymphoid markers using Whole-mount in situ hybridization (WISH) in 5 dpf WT (stat5.1 ), deleted transactivation domain ( TAD) (stat5.1 ), TM (stat5.1 ) and knockout (KO) (stat5.1 ) embryos showing representative individuals for rag1 (A) and lck (B). Green arrows indicate the thymic region and 0.5 mm scale bars are shown. The relative area of expression for rag1 (C) and lck (D) was quantified comparative to the WT that was set at 100%, with mean and standard error of the mean (SEM) (n = 25–30) displayed. (E,F) Expression analysis of representative lymphoid marker genes by quantitative real-time reverse-transcription polymerase chain reaction (qRT -PCR) in the kidney (E) and spleen (F) from adult male fish of the indicated genotypes. Primary data were normalized relative to actb and represented as fold-change showing mean and SEM (n = 5). For panels (C–F), the level of statistical significance is indicated. *: p 0.05, **: p 0.01, ***: p 0.001 compared to WT; #: p 0.05 compared to KO; ns: not significant.
|
