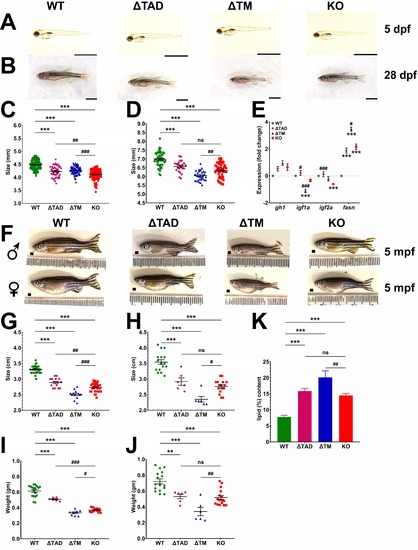
Analysis of growth and adiposity in Stat5.1 mutants. (A–B, F) Images of representative WT (stat5.1 ), TAD (stat5.1 ), TM (stat5.1 ), and KO (stat5.1 ) individuals at 5 dpf (A), 28 dpf (B), and 5 mpf for male (♂) and female (♀) adults (F). Scale bars represent 2 mm in panels (A) and (B), with ruler increments of 1 mm in panel (F). (C,D,G–J) Analysis of size for fish with the indicated genotypes, showing quantitation of length at 5 dpf (C), 28 (D) and 5 mpf for male (G) and female (H) fish, and weight at 5 mpf for male (I) and female (J) fish of the indicated genotypes showing mean and SEM (5 dpf: n = 90–150; 28 dpf: n = 30–45; 5 mpf: n = 6–15) (J,K). (E) Expression analysis of the indicated genes involved in growth and lipid biosynthesis by qRT -PCR in 28 dpf WT, TAD, TM, and KO juveniles. Data were normalized relative to the actb and represented as relative fold-change showing mean and SEM (n = 5). (K) Quantitation of total lipid content for WT, TAD, TM, and KO of 5 mpf adult females each, represented as a percentage of wet weight showing mean and SEM (n = 6). For panels (C–E), (G,H), and (I,J) the level of statistical significance is indicated. **: p 0.01, ***: p 0.001 compared to WT; #: p 0.05, ##: p 0.01, ###: p 0.001 compared to KO; ns: not significant.
|
