|
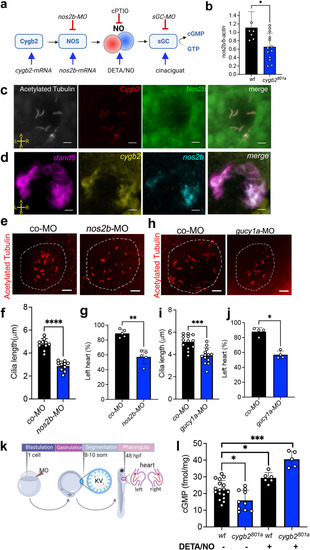
Perturbations of the NO signaling pathway phenocopy cygb2 mutants. a Schematic of Cygb2-NO-sGC signaling outlining experimental approaches to activate and inhibit the pathway. Panel generated with BioRender.com. b mRNA expression of nos2b relative to β-actin at 8–10 somites normalized to wt expression quantified by qRT-PCR. Means are ± SD (n = 6–12, each n is the lysate of 50 embryos). c Immunostaining of acetylated tubulin (white), Cygb2 (red) and Nos2b (green) on whole mount embryos. d Whole mount fluorescence in situ hybridization labeling dand5 (pink), cygb2 (yellow) and nos2b (cyan) transcripts using RNAscope. c, d show representative images of three experiments. e, h Immunostaining of acetylated tubulin in the KV of scrambled control and nos2b or gucy1a morphants. The KV is outlined with a white dashed line. f, i Average cilia length, means are ± SD (n = 10–13 embryos). Student’s t test, two-tailed, ****P < 0.0001, ***P < 0.001. g, j Percentage of embryos with left-sided hearts in control morphants (co-MO) versus nos2b (ATG MO) and gucy1a (ATG MO) morphants, means are ± SD (n = 4–5, each n representing an independent experiment consisting of 50 embryos). Student’s t test, two-tailed, **P < 0.01, *P < 0.05. k Experimental schematic demonstrating the timing of morpholino (MO) injection, KV formation and left/right patterning phenotype. Panel generated with BioRender.com. l cGMP levels were measured by ELISA comparing wt to cygb2pt801a with and without 250 μM DETA/NO treatment. Means are ± SD (n = 5–17 independent replicates with each sample representing 50 pooled embryos at 8–10 somites). Student’s t test, two-tailed, *P < 0.05, ***P < 0.001. Image orientation: A- anterior, P- posterior, L- left, R- right. Scale bar = 10 μm. Source data are provided as source data file.
|