
FIGURE
Fig. 3
- ID
- ZDB-FIG-231215-124
- Publication
- Wu et al., 2021 - Genetic and epigenetic orchestration of Gfi1aa-Lsd1-cebpα in zebrafish neutrophil development
- Other Figures
- All Figure Page
- Back to All Figure Page
Fig. 3
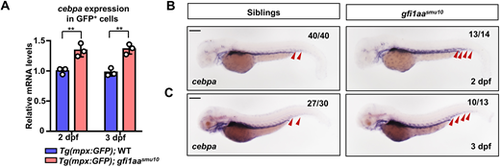
Increased cebpa expression in the gfi1aasmu10 mutant. (A) Relative expression of cebpa in FACS-sorted mpx:GFP+ cells. qPCR of 2 dpf and 3 dpf Tg(mpx:GFP);WT and Tg(mpx:GFP);gfi1aasmu10 mutants. **P<0.01 (Student's t-test; mean±s.e.m. of three independent experiments). (B,C) Upregulation of cebpa in gfi1aasmu10 mutant embryos. WISH of 2 dpf and 3 dpf sibling (left) and gfi1aasmu10 mutant (right) embryos. The numbers in top right corner indicate the number of embryos exhibiting this representative expression. Red arrows indicate the signals. P<0.0001 (Fisher's exact test). Scale bars: 200 μm. |
Expression Data
| Gene: | |
|---|---|
| Fish: | |
| Anatomical Term: | |
| Stage Range: | Long-pec to Protruding-mouth |
Expression Detail
Antibody Labeling
Phenotype Data
| Fish: | |
|---|---|
| Observed In: | |
| Stage Range: | Long-pec to Protruding-mouth |
Phenotype Detail
Acknowledgments
This image is the copyrighted work of the attributed author or publisher, and
ZFIN has permission only to display this image to its users.
Additional permissions should be obtained from the applicable author or publisher of the image.
Full text @ Development