
Fig. 4
- ID
- ZDB-FIG-231204-45
- Publication
- Bampali et al., 2023 - GABAA receptor-mediated seizure liabilities: a mixed-methods screening approach
- Other Figures
- All Figure Page
- Back to All Figure Page
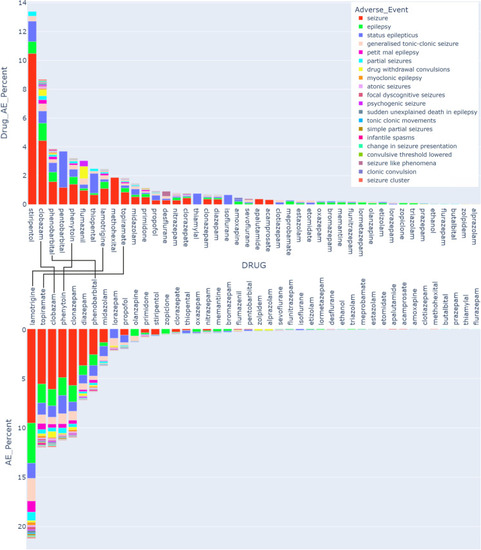
Pharmacovigilance data. The upper box plot displays the fraction (in %) of each AE for a specific drug from the total number of reports for this drug. The drugs are sorted by the total burden of the seizure/convulsion groups of AE, and the AEs in the legend are also sorted by the size of their contribution to the total AE count for these drugs. The lower box plot displays the fraction (in %) of the cumulative seizure AEs for each drug among the total reports in the seizures MedDRA category (46,285 total reports). Compounds which occur in the top 10 of both are connected. The total reports and the reports per AE per drug for the selected drugs and AEs are shown in Supplementary Table |