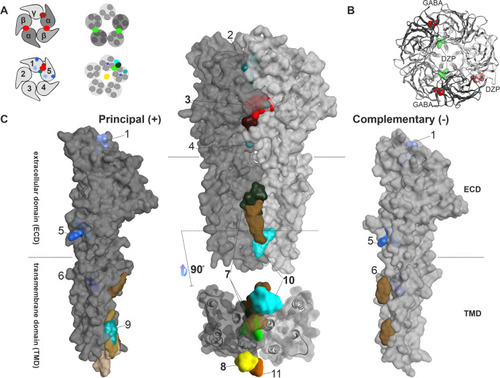
Summary of all identified and putative binding sites, for which structural evidence exists. A Top: representation of αβγ GABAAR pentamers. Below: representation of a generic pentamer. Representative intrasubunit binding sites and interfaces found on the ECD (left), TMD (right), as well as the channel pore (right) are depicted. Colors are matching the ones depicted in panels B, C. B Top view of an atomic model of an α1β3γ2 GABAAR (6HUP) in ribbon representation, with GABA and diazepam binding to the ECD, as well as the diazepam TMD binding site shown in surface filling representation. C All intrasubunit binding sites that can be found on the principal ( +) side in dark grey (left). Representation of all binding sites that occupy an interface between two subunits (middle). Representation of all intrasubunit binding sites that can be found on the complementary (-) side in light grey (right). The extracellular and transmembrane domains are marked as ECD and TMD on the individual subunit renderings, and dashed lines indicate the approximate localization of the lipid collar in the space filling renderings. Below the upright dimer, a view of the transmembrane domain binding sites as seen from the intracellular space is depicted. The surface maps of the principal and complementary sides that are depicted in this summary were obtained from 6HUP. All ligands are shown in space filling representation (representative ligands for each site: 1—“fragment” in sky blue, 2—AM-3607 in turquoise, 3—GABA/diazepam in red and ketamine in dark red, 4—Ba2 + -atom in cadet grey, 5—chlorpromazine in ocean blue, 6—propofol in navy blue, 7—diazepam in light green and avermectin in dark green, 8—picrotoxin in yellow, 9—pregnenolone sulfate in light cyan, 10—alphaxolone in dark cyan, 11—memantine in orange. Brown sites represent lipid-associated sites (e.g., cholesterol in light and dark brown, PIP2 in sand). Sites 1, 5, 6, and 9 are intrasubunit-located, whereas sites 2, 3, 4, 7, and 10 are interface-located. Site 8 and site 11 are located within the channel pore. This summary of binding sites resulted from a superposition of atomic resolution structures of GABAAR and homologous proteins. The PDB files used, citations, as well the full description of the ligands occupying the binding sites can be found in Supplementary Table S1. Note that structural data for the intracellular domain is lacking
|

