
FIGURE
FIGURE 4
- ID
- ZDB-FIG-231201-4
- Publication
- Guzelkaya et al., 2023 - A zebrafish model for studying the mechanisms of newborn hyperbilirubinemia and bilirubin-induced neurological damage
- Other Figures
- All Figure Page
- Back to All Figure Page
FIGURE 4
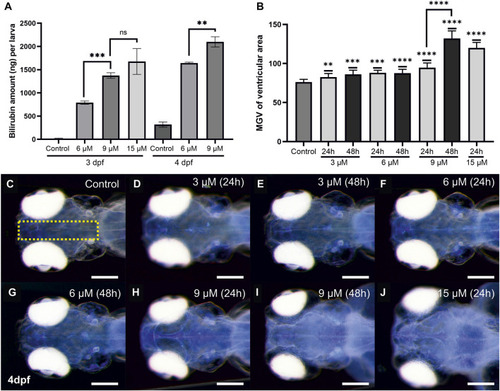
Quantitative analyses of bilirubin accumulation: |
Expression Data
Expression Detail
Antibody Labeling
Phenotype Data
Phenotype Detail
Acknowledgments
This image is the copyrighted work of the attributed author or publisher, and
ZFIN has permission only to display this image to its users.
Additional permissions should be obtained from the applicable author or publisher of the image.
Full text @ Front Cell Dev Biol