|
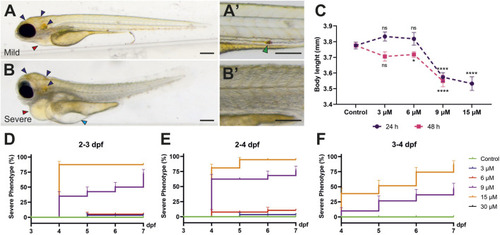
Mild and severe phenotypes: The larvae exposed to 9 µM bilirubin between 2–3 dpf display (A) mild or (B) severe phenotypes at 4 dpf. Close-up images are shown next to the overview images. navy, blue and red arrows represent bilirubin, yolk edema and pericardial edema, respectively. The green arrow indicates bilirubin excreted from the GI tract. Scale bars: 200 µm. (C) Average body length of larvae treated with bilirubin at 2–3 dpf for 24 h (purple line) or at 2–4 dpf for 48 h (pink line) shows a significant shortening of body length upon 9–15 µM bilirubin exposure. (D–F) Penetrance of the severe phenotype after exposure to bilirubin between (D) 2–3 dpf, (E) 2–4 dpf and (F) 3 - 4 dpf. Larvae were treated with vehicle, 3 μM, 6 μM, 9 µM or 15 µM bilirubin. The mean ± SEM was calculated from triplicate treatments of 15 larvae in each group.
|