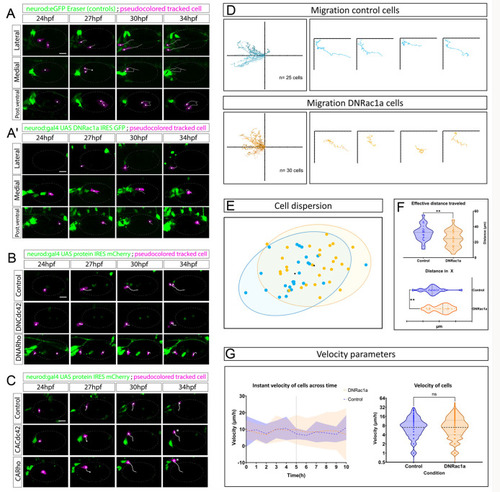
Otic NBs engage in RhoGTPase-dependent active and directed migration. (A,A′) Three NBs migrating from lateral, medial and posteroventral regions in control wild-type conditions under CRISPR Eraser in Tg(neurod:eGFP) (A) or in fish overexpressing DNRac1a (A′) (magenta pseudocoloured cells, tracks in white). See also Movie 7. (B) Migratory pattern under DNCdc42 and DNRho conditions. DNCdc42 and DNRho recapitulate the effect of reduced directed migration. (C) In contrast, CACdc42 and CARho show similar or even enhanced migration compared with control cells (asterisks). (D) Summary of tracked control and DNRac1a-expressing cells using DiPER. Tracks are normalized at the origin according to published protocols (Breau et al., 2017; Gorelik and Gautreau, 2014). Control cells migrate further and more directionally than DNRac1a cells. (E) Dispersion of cells (95% confidence interval) at the endpoint of the time lapse after normalization of tracks to the origin, in control (blue) and DNRac1a (orange) conditions. (F) Effective distance migrated is significantly compromised in DNRac1a compared with controls. This is measured as the length of a straight line between the start and end point of a given cell irrespective of their particular migratory path in the recordings. The distance covered in the x-axis is also compromised. Ticks in the x-axis represent increase every 10 µm. **P<0.005 (Mann-Whitney U-test for non-parametric data). (G) Instant velocities (space covered/time between frames) of delaminated NBs across time. The migratory capacity of cells is affected little because the mean (blue and orange dashed lines) of both control NB and DNRac1a NB is the same, although dispersion of standard deviation increases towards the end of the recording in the DNRac1a condition (orange area) versus controls (blue area). Black vertical dashed line indicates half of the recording time. For detailed tracked velocities, see Fig. S6. For DNRac1a analysis, the phenomenon was observed in n=25 control cells and n=30 DNRac1 cells, from 7 and 14 embryos, respectively. Scale bars: 20 µm. See Fig. S6 for individual cell migratory profiles. Regarding Cdc42 and Rho1 experiments, control cells of the DN condition migrate normally in 2/2 cases; DNCdc42 cells migrate normally in 4/7; DNRho cells migrate normally in 1/4 cases. Control cells of the CA condition migrate normally in 5/5 cases; CACdc42 cells migrate normally in 3/6; CARho cells migrate normally in 1/4 cases. Controls were injected with UAS:mCherry plasmid. All embryos were siblings from the same batch of injection. In images, the otic vesicle is outlined with a faint grey dashed ellipse. Tracked cells are pseudocoloured in magenta and tracks in white. Scale bars: 20 µm. See also Movie 8. ns, not significant.
|
