
FIGURE
Fig. 1
Fig. 1
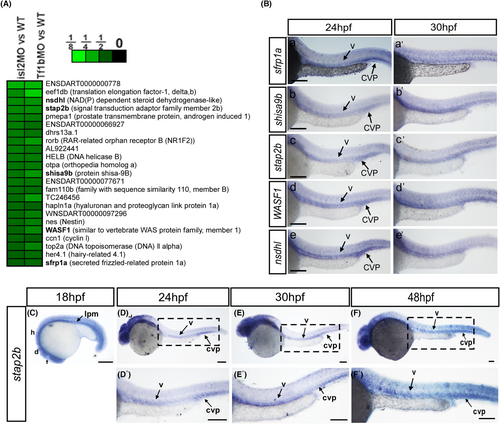
The expression pattern of the selective targets suggested their function in vasculature. (A and B) Microarray data analysis identified 23 targets that were positively regulated by isl2 and nr2flb |
Expression Data
Expression Detail
Antibody Labeling
Phenotype Data
Phenotype Detail
Acknowledgments
This image is the copyrighted work of the attributed author or publisher, and
ZFIN has permission only to display this image to its users.
Additional permissions should be obtained from the applicable author or publisher of the image.
Full text @ FASEB J.