- Title
-
Functional characterization of stap2b in zebrafish vascular development
- Authors
- Wang, Y.S., Chen, Y.T., Wu, C.Y.
- Source
- Full text @ FASEB J.
|
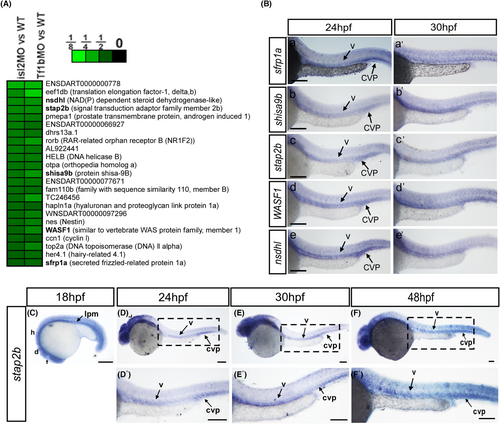
The expression pattern of the selective targets suggested their function in vasculature. (A and B) Microarray data analysis identified 23 targets that were positively regulated by isl2 and nr2flb |
|
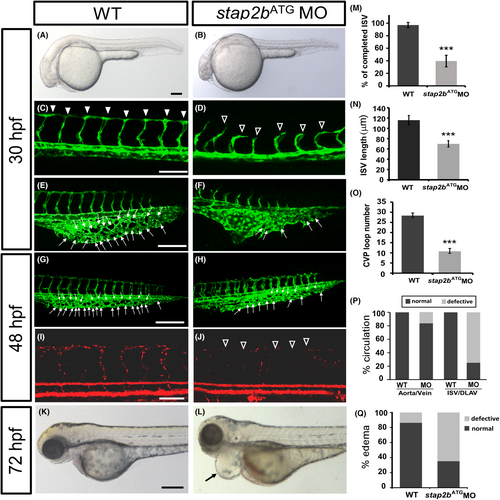
Knockdown of stap2b causes vascular defects in zebrafish development. (A and B) Bright field images of wild-type and stap2bATG morpholino (1.28 ng)-injected embryos. (C–F) At 30 hpf, ISVs reached DLAV and formed a honeycomb-like structure in the caudal vein plexus (CVP) in wild-type controls and Tg (flk:eGFP) zebrafish (C and E). Compared with the wild-type control (arrowhead in C, arrow in E and G), loss of stap2b caused ISV growth defects (hollow arrowheads in D) and reduced honeycomb-like structure formation in the CVP (arrows in F and H) at 30 hpf and 48 hpf. (I and J) The injection of stap2bATG MO into Tg (fli:eGFPy1;gata1:dsRed) embryos revealed that loss of stap2b caused circulation defects in ISVs at 48 hpf. (K and L) At 72 hpf, stap2bATG morphants exhibited pericardial edema (arrow in L), causing circulation defects. (M) The percentage of completed ISVs decreased by approximately 50% in the stap2bATG morphants (n = 18 in controls and n = 24 in stap2bATG morphants) at 30 hpf. (N) The average length of ISVs in stap2bATG morphants (n = 30, 69.8 ± 6.1 μm) was shorter than the length in controls (n = 30, 115.9 ± 8.9 μm) at 24 hpf. (O) Loop formation in CVP was decreased in the stap2bATG morphants (n = 25 in controls and n = 33 in stap2bATG morphants) at 30 hpf. (P) Quantification data revealed that compared with the controls with defects, the stap2b morphants showed 75% more defects in the ISV-DLAV circulation and 18% more defects in aorta-vein circulation (n = 12 in controls and n = 33 in stap2bATG morphants) at 48 hpf. (Q) The percentage of stap2b morphants with pericardial edema was 65% greater than that was 15% in the controls (n = 29 in controls and n = 34 in stap2bATG morphants) at 72 hpf. Data are represented as means ± S.D. ***Refers to p < .001 by an unpaired Student's t-test. Scale bar are 200 μm for A, B, K, L and 100 μm for C–J. |
|
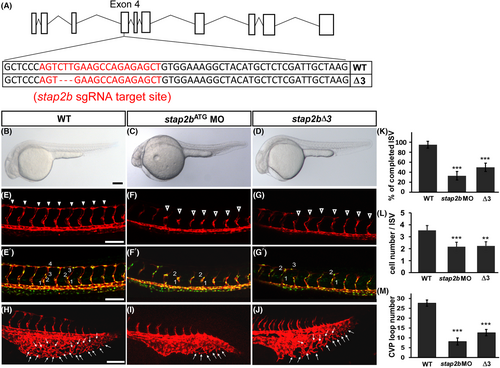
stap2b knockout embryo phenocopy morphant's phenotype. (A) Schematic showing the Cas9-gRNA targeted site in stap2b. The protospacer-adjacent motif (PAM) sequence is GGG, and the targeted sequence is labeled in red. (B–D) Bright field images of wild-type (WT), stap2bATG morpholino injected embryos (stap2bATG MO) and stap2b-knockout embryos (stap2bΔ3). (E–G) At 30 hpf, compared to wt controls, knockout of stap2b (stap2bΔ3) showed an ISV growth defect similar to the phenotype of stap2b morphants, which was induced by morpholino injection (hollow arrowhead in C and D). (n = 12 in WT embryos, n = 13 in stap2b morphant embryos, and n = 14 in stap2b knockout embryos). (E′–G′) Loss of stap2b in morpholino and stap2b-knockout Tg (kdrl:mCherry; fli1a:negfp y7) embryos showed that the cell number per ISV was less than that in WT embryos. (H–J) Meanwhile, CVP loop formation was lower (arrows in I and J) in stap2b morphants and stap2bΔ3 mutants than in WT control (H). (K) Quantification of the percentage of completed ISVs in stap2b morphant and stap2b-knockout embryos was 55% and 35% reduced compared to WT embryos. (L and M) Quantification of the average cells per ISV and CVP structure in WT embryos, stap2b morphants and stap2b-knockout embryos. Scale bars are 200 μm for B-D and 100 μm for E–G, E′–G′ and H-J. (***Refers to p < .001 and **refers to p < .01) |
|
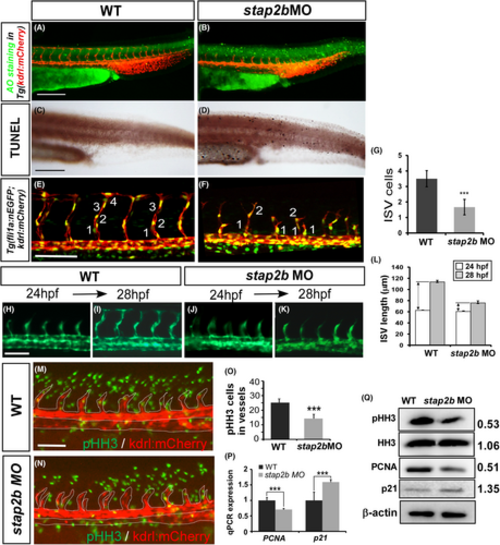
Knockdown of stap2b impairs the growth of ISV. (A–D) AO staining and TUNEL assays were performed to detect apoptotic cells in wild-type control (A and C) and stap2bATG morphants (B and D). Some apoptotic cells were observed in the skin of the morphants, but these cells did not appear at the sites of vasculature. (E and F) Injection of stap2bATG morpholino into Tg (kdrl:mCherry; fli1a:negfp y7) shows the cell number per ISV less than that of the control (M) at 30 hpf. (G) Quantification of average cells per ISV in control and stap2bATG morphants 30 hpf (n = 12 in controls and n = 9 in stap2bATG morphants). (H–K) A migration assay was performed to measure the difference in ISV length from 24 hpf to 28 hpf in control and stap2b morphants (n = 12 in control and morphants), and the quantitative results are shown in (L). (M and N) The proliferation marker pHH3 (green spots) was detected by immunofluorescence in the vessels (red area within white dash line). (O) The number of mitotic cells (pHH3 cells) counted in the controls and stap2b morphants was 25 ± 2.4 and 14.4 ± 2.9, respectively (n = 10 in control and n = 9 in morphants). (P) Quantification of the relative expression level as determined by real-time PCR showed reduced expression of another proliferation marker, PCNA (0.70 ± 0.02), and increased expression of the cell cycle inhibitor p21 (1.59 ± 0.07). (Q) The results from Western blot analysis showed reduced protein expression of pHH3 and PCNA and increased expression of p21. β-actin and histone H3 were the loading controls. The densitometry results are normalized and shown aside. ***Refers to p < .001 and **refers to p < .01 by an unpaired Student's t-test. Scale bars are 200 μm for A–D, and scale bar are 100 μm for E, F, H–K, M and N. |
|
Knockdown of stap2b modulates the expression of vascular markers. Compared to that in wild-type controls (A, C, E, G, and I), expression of panvascular markers Flk (B) and satbilin (D), arterial marker ephrinb2 (F), and venous markers mrc1 (H) and flt4 |
|
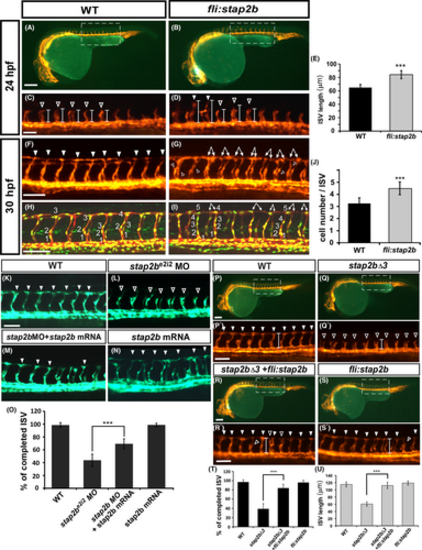
Overexpression of stap2b enhances vessel growth and rescues the loss of stap2b in zebrafish development. (A–G) Overexpression of stap2b driven by the fli promoter enhanced the growth of ISVs in the Tg (kdrl:mCherry) |
|
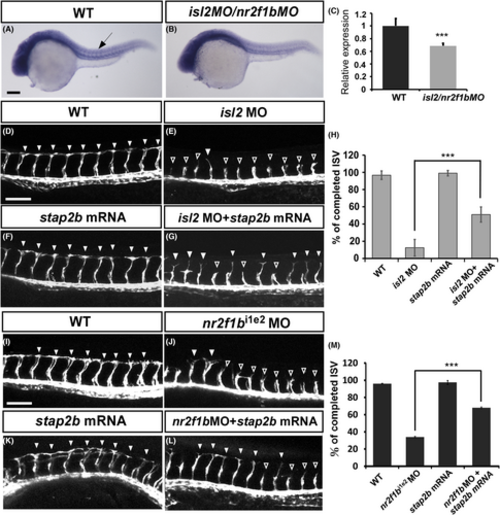
stap2b likely functions downstream of isl2 and nr2flb. (A and B) In situ hybridization showed that stap2b expression was reduced in isl2/nr2f1b morphants (B) compared to wild-type embryos (A). (C) Quantification of the relative expression level of stap2b in wild-type embryos and isl2/nr2f1b morphants. (D–G) Compared to uninjected wild-type Tg (kdrl:mCherry) embryos (D, n = 10), isl2ATG morphants showed an ISV growth defect (hollow arrowhead in E, n = 10). Injection of stap2b mRNA embryos (F, n = 10) showed completed ISV growth at 30 hpf, and coinjection of the isl2ATG morpholino with stap2b mRNA partial rescue the vascular defect in isl2ATG morphants (arrowhead in G, n = 10). (H) Quantification of the percentage of completed ISVs shows an increase of 40% in the embryos coinjected with isl2ATG morpholino and stap2b mRNA compared with that of the isl2ATG morphants at 30 hpf. (I–L) Uninjected wild-type embryos (I, n = 18) and injected stap2b mRNA embryos (K, n = 12) showed completed ISV growth at 30 hpf. Coinjection of the nr2f1bi1e2 morpholino with stap2b mRNA (arrowhead in L, n = 10) reversed the vascular defect in nr2f1bi1e2 morphants (hollow arrowhead in J, n = 14) at 30 hpf. (M) Quantification of the percentage of completed ISVs shows an increase of 34% in the embryos coinjected with nr2f1bi1e2 morpholino and stap2b mRNA compared with that of the nr2f1bi1e2 morphants. Scale bar are 200 μm for A and B, and 100 μm for D–L. Data are shown as means ± S.D. ***Refers to p < .001 by an unpaired Student's t-test. |
|
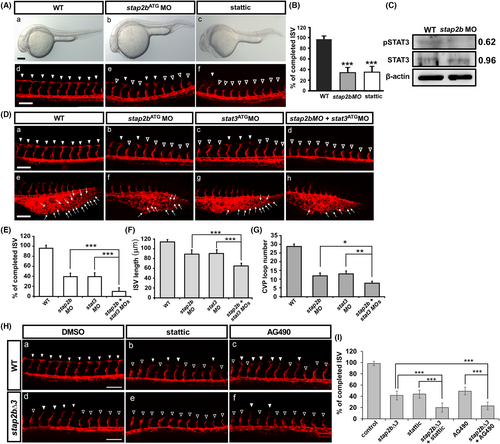
Vascular patterning mediated by the interaction between stap2b and the Jak-Stat3 pathway. (Aa–Ac) Bright field images of wild-type, stap2bATG morphants and embryos treated with the STAT3-specific inhibitor stattic at 30 hpf. (Ad–Af) At 30 hpf, compared with the effect in the wild-type control (Ad), treatment of embryos with stattic caused a growth defect of ISVs similar to that of stap2b morphants (hollow arrowheads in Ae and Af). (B) Quantification of the percentage of completed ISVs in stap2b morphant and stattic-treated embryos was reduced approximately 60–65% compared to wt control. (C) A Western blot analysis showed reduced phosphorylation of Stat3 in stap2b morphants, and β-actin was a loading control. The densitometry results are normalized and shown aside. (D–G) Double knockdown of stap2b and stat3 enhanced vascular defects during zebrafish development. (Da–Dd) At 30 hpf, the wild-type control showed normal growth of ISVs and CVP formation (arrowheads in Da, arrows in De). Double knockdown of stap2b and stat3 enhanced vascular defects in ISVs (hollow arrowheads in Dd), and fewer sprouting or loop structures in the CVP (arrows in Dh) compared to lower- dosage of stap2b (Db and Df, 0.85 ng) or stat3 (Dc and De, 0.85 ng) morpholino knockdown. (E) Quantification of the percentage of completed ISVs is approximately 95%, 38%, 39% and 8% in the wt control, stap2bMO, stat3MO and double-knockdown morphants (n = 20 in wt, n = 17 in stap2b MO, n = 16 in stat3 MO and n = 16 in stap2b + stat3 MOs) at 30 hpf. (F) Double knockdown of stap2b and stat3 caused the shorter average length of ISVs than in stap2bMO and in stat3MO. The average length in wt control, stap2bMO, stat3MO, and double-knockdown morphants was 113.1 ± 4.9 μm, 90.7 ± 8.1 μm, 92.9 ± 6.8 μm, and 68.5 ± 5.2 μm (n = 30 in wt, stap2b MO, stat3 MO and in stap2b + stat3 MOs) at 30 hpf. (G) Quantification of the number of loop structures in the CVP was approximately 28, 11, 12 and 8 in wt control, stap2bMO, stat3MO and double-knockdown morphants (n = 22 in wt, n = 21 in stap2b MO, n = 18 in stat3 MO and n = 18 in stap2b + stat3 MOs). (Ha–Hc) At 30hpf, compared to DMSO control in WT, treatment with JAK-specific inhibitor AG490 caused a growth defect in the ISVs (hollow arrowheads in Hc), similar to the vessel defects in stattic-treated embryos (hollow arrowheads in Hb). While chemical treatments in stap2b mutant (stap2bΔ3), stattic-treated stap2b mutants (He) showed the enhanced impairment of ISV growth compared to the vessel defect in DMSO-treated stap2b mutant (Hd) or stattic-treated (Hb) wild-type embryos. Similarly, AG490-treated stap2b mutants (Hf) enhanced the defect of ISV growth compared to DMSO-treated stap2b mutant (Hd) or AG490-treated wild-type embryos (Hc). (I) The percentage of completed ISVs in static or AG490-treated WT embryos or stap2b knockout embryos was quantified. Data are represented as means ± SD. ***Refers to p < .001, **refers to p < .01, and *refers to p < .05 by an unpaired Student's t-test. Scale bars are 200 μm for Aa–Ac, and 100 μm for Ad–Af, Da–Dh, Hd–Hf. |
|
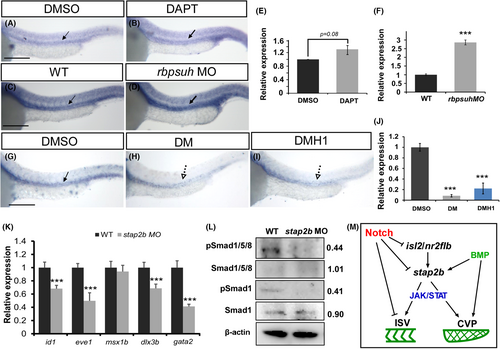
Interaction between stap2b and Notch or bone morphogenetic protein (BMP) signals to control vascular patterning. (A–D) stap2b expression is increased while inactivation of Notch signals, as determined by in situ hybridization of DAPT-treated embryos (B) or knockdown of rbpsuh (D) compared to the wild-type control (C) at 24 hpf. (E and F) Quantification of the relative expression level of stap2b in DMSO control and DAPT-treated embryos (E), and in uninjected wt control and rbpsuh morphants (F). (G–J) DM and DMH1 were used to inhibit BMP signaling. Stap2b expression was reduced in DM- and DMH1-treated embryos (H and I) compared to the DMSO control (G) at 30 hpf. (J) Quantification of the relative expression level of stap2b in control, DM-treated and DMH1-treated embryos at 30 hpf. (K) Quantification of the relative expression level of BMP-regulated genes in stap2b morphants. The expression of id1 (0.68 ± 0.04), eve1 (0.49 ± 0.12), dlx3b (0.68 ± 0.06), and gata2 (0.41 ± 0.03) was reduced in stap2b morphants, but the expression of msx1b (0.94 ± 0.09) was not changed. (L) Western blots and densitometry analysis showed reduced phosphorylation of Smad1/5/8 and Smad1 in stap2b morphants compared to the control, and β-actin was a loading control. Scale bars are 200 μm for A–D and G–I. Data are shown as means ± S.D. ***Refers to p < .001 by an unpaired Student's t-test. (M) A schematic drawing of the proposed interaction of stap2b with multiple signaling proteins to control vascular growth in this study. |

