|
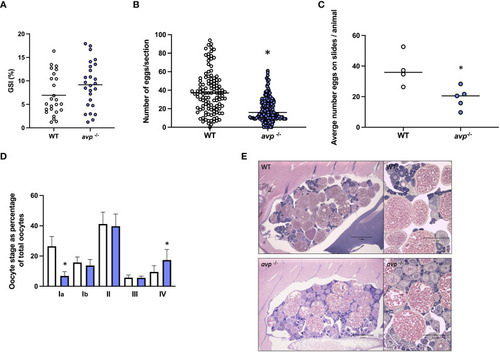
(A) (Mean) gonadosomatic index of WT (n=25) and avp -/- (n=26) females. (B, C) (Median) total oocyte number, and oocytes staged from ovarian histology sections of WT (n=4, 120 total sections) and avp-/- (n=5, 150 total sections). (D) Representative ovarian histology sections form WT and avp-/- females maximum diameter measurements to determine oocyte stage distribution as (mean) percentage (± S.E.M.) of overall oocytes according to the classification system described by Li and Ge (2020). Data were analyzed by t-test in case of normal distribution and Mann-Whitney U test in case of non-normal distribution. Asterisks indicate significant differences (P<0.001 in (B); P<0.05 in (C, D). (E) Ovarian histology sections from gravid WT (top panel) and avp-/- fish (bottom panel) imaged using a stereomicroscope (left images) and light microscope respectively (right images).
|