IMAGE

Figure 5

ID
ZDB-IMAGE-230916-270
Source
Figures for Ramachandran et al., 2023
Image
Figure Caption

Figure 5

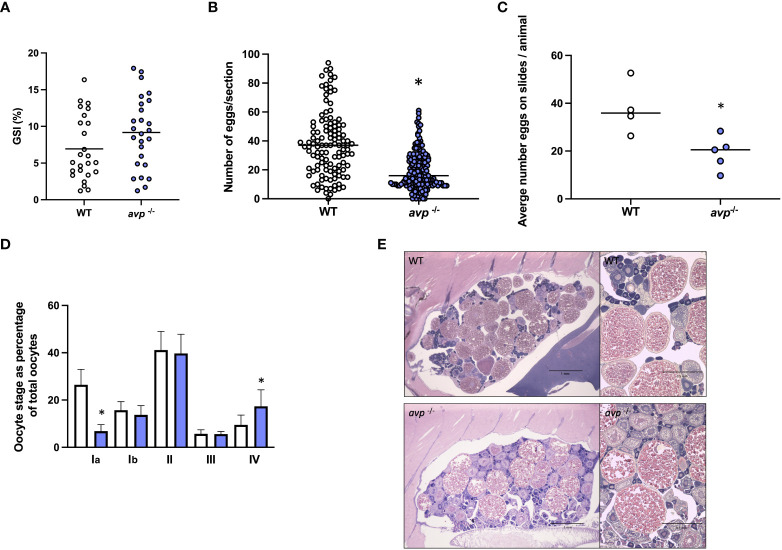
(A) (Mean) gonadosomatic index of WT (n=25) and avp -/- (n=26) females. (B, C) (Median) total oocyte number, and oocytes staged from ovarian histology sections of WT (n=4, 120 total sections) and avp-/- (n=5, 150 total sections). (D) Representative ovarian histology sections form WT and avp-/- females maximum diameter measurements to determine oocyte stage distribution as (mean) percentage (± S.E.M.) of overall oocytes according to the classification system described by Li and Ge (2020). Data were analyzed by t-test in case of normal distribution and Mann-Whitney U test in case of non-normal distribution. Asterisks indicate significant differences (P<0.001 in (B); P<0.05 in (C, D). (E) Ovarian histology sections from gravid WT (top panel) and avp-/- fish (bottom panel) imaged using a stereomicroscope (left images) and light microscope respectively (right images).

Acknowledgments
This image is the copyrighted work of the attributed author or publisher, and ZFIN has permission only to display this image to its users. Additional permissions should be obtained from the applicable author or publisher of the image. Full text @ Front Endocrinol (Lausanne)