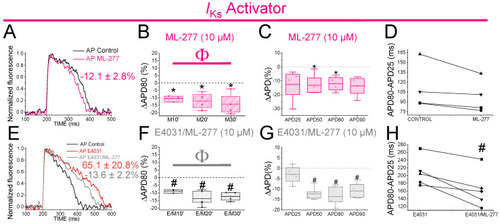
ML-277 shortens zebrafish AP before and after drug-induced LQT2. (A) Representative zebrafish AP traces before (black) and after (pink) applying ML-277 (10 µM). (B) ΔAPD80 (%) after applying ML-277 (10 µM), measured at different recording times (10, 20, and 30 min after application of ML-277). (C) ΔAPD(%) produced by ML-277 measured for the APD25, APD50, APD80, and APD90. (D) Effect of ML-277 on phase 3 of the AP. APD80–APD25 in the control conditions and after ML-277 application. (E) Representative zebrafish AP traces before (black) and after sequentially applying E4031 (10 µM, red) and E4031/ML-277 (10 µM/10 µM, grey). (F) ΔAPD80 (%) measured at different recording times (10, 20, and 30 min after application of the combination drug/ML-277). The E4031 recording, measured at 30 min, was used as the control condition. (G) ΔAPD (%) produced by the combination of drug/ML-277 measured for the APD25, APD50, APD80, and APD90. (H) Effect of the combination of drug/ML-277on phase 3 of the AP. APD80–APD25 in E4031 (control conditions) and after E4031/ML-277 application (mean ± SEM; * p < 0.05 vs. control conditions, #p < 0.05 vs. E4031 condition, Φp < 0.05 APD80 time data average vs. its control condition; control condition or E4031 condition). Each symbol in panels D and H represent data from a different experiment.
|
