IMAGE

Figure 7

ID
ZDB-IMAGE-230814-245
Source
Figures for De la Cruz et al., 2023
Image
Figure Caption

Figure 7

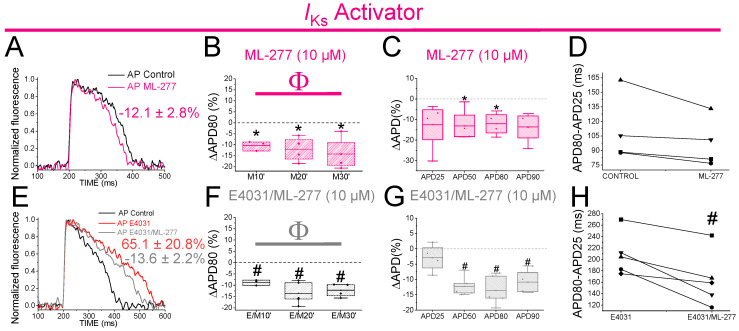
ML-277 shortens zebrafish AP before and after drug-induced LQT2. (A) Representative zebrafish AP traces before (black) and after (pink) applying ML-277 (10 µM). (B) ΔAPD80 (%) after applying ML-277 (10 µM), measured at different recording times (10, 20, and 30 min after application of ML-277). (C) ΔAPD(%) produced by ML-277 measured for the APD25, APD50, APD80, and APD90. (D) Effect of ML-277 on phase 3 of the AP. APD80–APD25 in the control conditions and after ML-277 application. (E) Representative zebrafish AP traces before (black) and after sequentially applying E4031 (10 µM, red) and E4031/ML-277 (10 µM/10 µM, grey). (F) ΔAPD80 (%) measured at different recording times (10, 20, and 30 min after application of the combination drug/ML-277). The E4031 recording, measured at 30 min, was used as the control condition. (G) ΔAPD (%) produced by the combination of drug/ML-277 measured for the APD25, APD50, APD80, and APD90. (H) Effect of the combination of drug/ML-277on phase 3 of the AP. APD80–APD25 in E4031 (control conditions) and after E4031/ML-277 application (mean ± SEM; * p < 0.05 vs. control conditions, #p < 0.05 vs. E4031 condition, Φp < 0.05 APD80 time data average vs. its control condition; control condition or E4031 condition). Each symbol in panels D and H represent data from a different experiment.

Acknowledgments
This image is the copyrighted work of the attributed author or publisher, and ZFIN has permission only to display this image to its users. Additional permissions should be obtained from the applicable author or publisher of the image. Full text @ Int. J. Mol. Sci.