FIGURE

Figure 1

ID
ZDB-FIG-230814-238
Publication
De la Cruz et al., 2023 - Pharmacological Screening of Kv7.1 and Kv7.1/KCNE1 Activators as Potential Antiarrhythmic Drugs in the Zebrafish Heart
Other Figures
All Figure Page
Back to All Figure Page
Figure 1

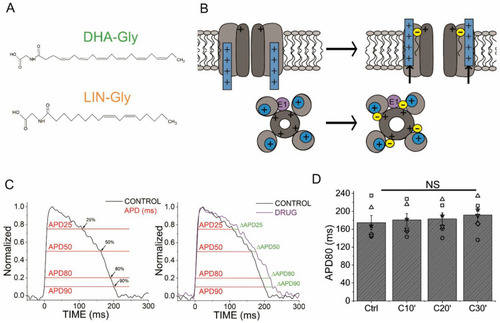
Schematic illustration of the topology of Kv7.1/KCNE1, the lipoelectric hypothesis and a zebrafish optical AP analysis diagram. (A) PUFA analogues’ molecular structure. (B) The lipoelectric hypothesis (previously shown in [2] but adapted to zebrafish Kv7.1/KCNE1 stoichiometry). Top, schematic illustration showing how the negatively charged head group of the PUFA analogue attracts the positively charged voltage sensor of the channel and activates the channel. Bottom, a second electrostatic effect of the negatively charged head group of the PUFA analogue with a positively charged residue located in the pore domain of the channels promotes the conductance increase in the channel. (C) Schematic of the optical AP analysis methodology. The left panel shows how the APD at different repolarization percentages was measured. The right panel shows how the change, ΔAPD (%), between the control conditions and the drug (in this example, chromanol 293B) was measured at different percentages of repolarization (APD25, APD50, APD80, and APD90). (D) APD80 (in ms) measured at different recording times (10, 20, and 30 min after the first control recording). Black bars show the control condition measured over time (C10′, C20′, and C30′) (mean ± SEM; NS: not significant). Each symbol represents data from a different experiment.

Expression Data

Expression Detail
Antibody Labeling
Phenotype Data

Phenotype Detail
Acknowledgments
This image is the copyrighted work of the attributed author or publisher, and ZFIN has permission only to display this image to its users. Additional permissions should be obtained from the applicable author or publisher of the image. Full text @ Int. J. Mol. Sci.