
Fig. 6
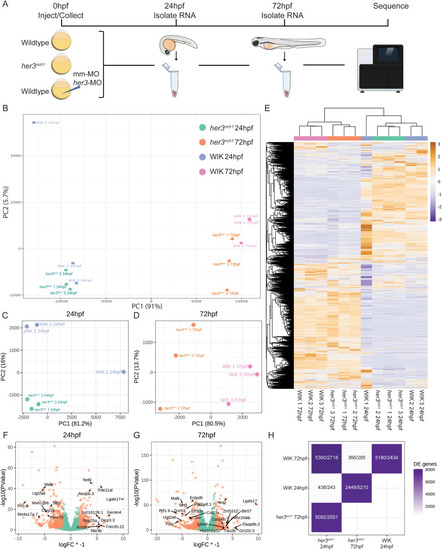
Fig. 6. Transcriptional impact of her3 mutation status. (A) Schematic of RNA collection. Embryos from wildtype WIK in-cross and her3nch1 in-cross were collected, with a subset of WIK embryos injected with either her3-MO or mismatch-MO. At 24hpf, RNA was isolated from 3 groups of 25 embryos each per condition, and again at 72hpf. RNA was then sent for sequencing. (B) PCA of all samples, excluding MO samples. (C–D) PCA of her3nch1 and WIK 24hpf samples (C) and 72hpf samples (D). (E) Heatmap clustering of all differentially expressed genes from her3nch1 and WIK samples. (F–G) Volcano plots of differentially expressed genes in her3nch1 compared to WIK 24hpf samples (F) and 72hpf samples (G). Differential expression was considered significant with an FDR ≤0.1 and absolute value of logFC ≥1.5. Top annotated up- and downregulated genes are labeled. (H) Tile chart showing pairwise comparisons of differentially expressed genes. Numbers are displayed as downregulated/upregulated of the groups along the x-axis. |
Reprinted from Developmental Biology, 496, Kent, M.R., Calderon, D., Silvius, K.M., Kucinski, J.P., LaVigne, C.A., Cannon, M.V., Kendall, G.C., Zebrafish her3 knockout impacts developmental and cancer-related gene signatures, 1141-14, Copyright (2023) with permission from Elsevier. Full text @ Dev. Biol.