
Fig. 4
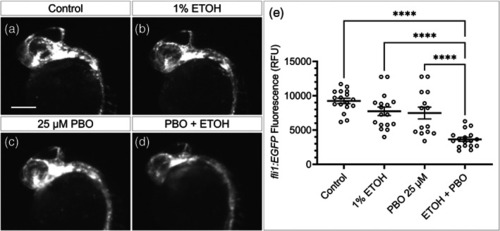
PBO and alcohol interact to synergistically reduce fli1:EGFP expression. (a–d) Fluorescent images of 26 h post fertilization (hpf) fli1:EGFP embryos exposed to control or the indicated concentration of PBO, ethanol, or both from 6–24 hpf showing a synergistic interaction between ethanol and PBO. (e) Column graph showing fli1:EGFP fluorescence measurements for each embryo (open circles). Black bars show mean fluorescence for each group ± SEM. Sample sizes: control n = 17; 1% ETOH n = 17; 25 μM PBO n = 14; ETOH+PBO n = 17. Statistic: two‐tailed ANOVA with Tukey's multiple comparison's correction between all groups. **** p < .0001. Scale bar = 0.2 mm. RFU = relative fluorescence units. ETOH = ethanol. PBO = piperonyl butoxide, environmental Hedgehog pathway inhibitor |