
Fig. 9
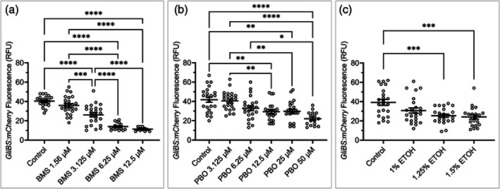
Monitoring Hedgehog pathway activity. (a) Column graph showing GliBS:mCherry fluorescence (a marker of Hedgehog pathway activity) for each embryo (open circles) exposed to the indicated concentration of the potent Hedgehog pathway inhibitor standard BMS‐833923 from 6–24 hpf. Black bars show mean fluorescence for each group ± SEM. Sample sizes: control n = 21; 1.56 μM BMS n = 24; 3.125 μM BMS n = 24; 6.25 μM BMS n = 16; 12.5 μM BMS n = 11. Many samples, n = 6 at 6.25 μM and n = 13 at 12.5 μM BMS were below fluorescence threshold and were omitted. Statistic: two‐tailed ANOVA with Tukey's multiple comparison's correction between all groups. (b) Column graph showing GliBS:mCherry fluorescence for embryos exposed to the environmental teratogen PBO from 6–24 hpf. Black bars show mean fluorescence for each group ± SEM. Sample sizes: control n = 23; PBO 3.125 μM n = 23; PBO 6.25 μM n = 23; PBO 12.5 μM n = 23; PBO 25 μM n = 23; PBO 50 μM n = 16. n = 7 samples exposed to 50 μM PBO were below the fluorescence threshold and were omitted. Statistic: two‐tailed ANOVA with Tukey's multiple comparison's correction between all groups. (c) Column graph showing GliBS:mCherry fluorescence for embryos exposed to ethanol from 6–24 hpf. Black bars show mean fluorescence for each group ± SEM. Sample sizes: Statistic: two‐tailed ANOVA with Tukey's multiple comparison's correction between all groups. * = p < .05, ** = p < .01, *** = p < .001, **** p < .0001. RFU = relative fluorescence units. BMS = BMS‐833923, Hedgehog pathway inhibitor standard. PBO = piperonyl butoxide, environmental Hedgehog pathway inhibitor |