
Fig. 7
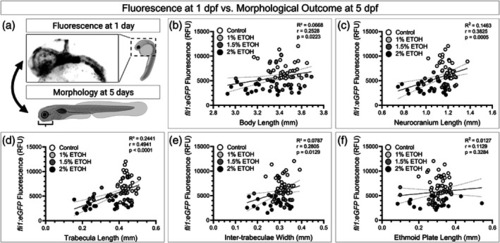
Expression of fli1:EGFP correlates with craniofacial morphometrics. (a) Schematic showing comparison of fluorescence at 1 dpf to craniofacial morphometrics at 5 dpf in the same animal. (b–f) Scatter plots of pair‐wise comparisons for each embryo, where (x = Morphological Measurement at 5 dpf, y = Fluorescence at 1 dpf). Data points are color coded by treatment group (black = control, light gray = 1% ETOH, dark gray = 1.5% ETOH, black = 2% ETOH.) Linear regression analysis mean (solid line) ± standard error (dotted lines) is shown. R 2‐value (coefficient of determination), r‐value (Pearson's correlation coefficient), and correlation p values are shown. RFU = relative fluorescence units. ETOH = ethanol |