
Fig. 10
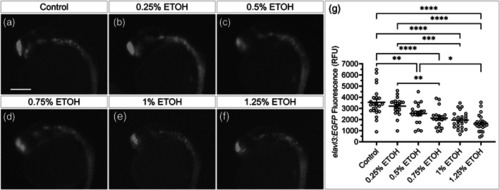
Subteratogenic doses of alcohol reduce neural progenitor (elavl3) expression. (a–f) Fluorescent images of 26 hpf elavl3:EGFP embryos exposed to control or the indicated concentration of ethanol from 6–24 hpf. (g) Column graph showing elavl3:EGFP fluorescent read for each embryo (open circles). Black bars show mean fluorescence for each group ± SEM. Sample sizes: control n = 24; 0.25% ETOH n = 22; 0.5% ETOH n = 20; 0.75% ETOH n = 19; 1.0% ETOH n = 24; and 1.25% ETOH n = 24. Statistic: two‐tailed ANOVA with Tukey's multiple comparison's correction between all groups. * = p < .05, ** = p < .01, *** = p < .001, **** p < .0001. Scale bar = 0.2 mm. RFU = relative fluorescence units. ETOH = ethanol |