|
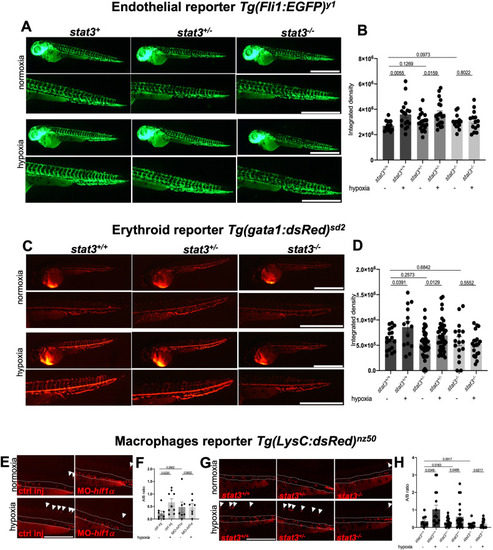
stat3 genetic ablation affects angiogenesis, and macrophage migration. A, B Representative pictures and fluorescence quantification of the trunk of 54-hpf stat3+/+, stat3+/− and stat3−/− in Tg(Fli1:EGFP)y1 transgenic background incubated in normoxia and hypoxia for 6 h. Scale bar: 1 mm. n = 15 stat3+/+ normoxia; 17 stat3+/+ hypoxia; 21 stat3+/− normoxia; 20 stat3+/− hypoxia; 14 stat3−/− normoxia; 14 stat3−/− hypoxia (larvae used for this experiment came from three independent breeding between stat3+/− zebrafish). C, D Representative pictures and fluorescence quantification of the tail of 54-hpf stat3+/+, stat3+/− and stat3−/− larvae in Tg(gata1:dsRed)sd2 transgenic background incubated in normoxia and hypoxia. Scale bar: 1 mm. n = 18 stat3+/+ normoxia; 14 stat3+/+ hypoxia; 41 stat3+/− normoxia; 44 stat3+/− hypoxia; 17 stat3−/− normoxia; 20 stat3−/− hypoxia (larvae used for this experiment came from four independent breeding between stat3+/− zebrafish). E, F Representative pictures of 54-hpf control (ctrl inj) and hif1α morphants (MO-hif1α) in Tg(LysC:dsRed)nz50 transgenic background incubated in normoxia and hypoxia for 6 h (scale bar: 500 μm) quantification of the ratio of dsRed-positive cells in region A and in region B. Area B between dashed lines. Arrowheads point at fluorescent cells in Area A. n = 8 ctrl inj normoxia; 9 ctrl inj hypoxia; 7 MO-hif1α normoxia; 8 MO-hif1α hypoxia (larvae used for this experiment came from three independent breeding between wild type zebrafish) G, H Representative pictures of 54-hpf stat3+/+, stat3+/− and stat3−/− larvae in Tg(LysC:dsRed)nz50 transgenic background incubated in normoxia and hypoxia for 6 h (scale bar: 500 μm); quantification of the ratio of dsRed-positive cells in region A and in region B. Area B between dashed lines. Arrowheads point at fluorescent cells in Area A. n = 11 stat3+/+ normoxia; 16 stat3+/+ hypoxia; 22 stat3+/− normoxia; 23 stat3+/− hypoxia; 11 stat3−/− normoxia; 17 stat3−/− hypoxia (larvae used for this experiment came from three independent breeding between stat3+/− zebrafish). Mean ± SEM.
|