
Fig. 5
- ID
- ZDB-FIG-230622-16
- Publication
- Kim et al., 2023 - UBAP2 plays a role in bone homeostasis through the regulation of osteoblastogenesis and osteoclastogenesis
- Other Figures
- All Figure Page
- Back to All Figure Page
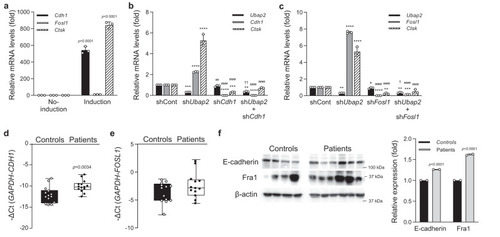
a mRNA expression levels of Cdh1, Fosl1, and Ctsk during osteoclast differentiation of primary cultured monocytes. Quantitative reverse-transcription PCR (qRT-PCR) was performed with the specific primers for Cdh1, Fosl1, and Ctsk. Relative mRNA expression was presented as fold change relative to No-induction and normalized to mouse Gapdh expression (n = 3 independent experiments; duplicate samples). Exact p-values of an unpaired two-tailed t-test are shown. b, c mRNA expression levels of target genes in the Ubap2, Cdh1 (shCdh1_#3), and Fosl1 (shFosl1_#3)-knockdown osteoclastogenesis-induced primary-cultured monocytes. qRT-PCR was performed as shown a (n = 3 independent experiments; duplicate samples). Statistical differences of multiple groups were determined using two-way ANOVA multiple comparisons. All data are presented as the mean ± SD. **p = 0.0012 vs. shCont; ***p = 0.0005 and p = 0.0004 vs. shCont; ****p < 0.0001 vs. shCont; ##, p = 0.0035 vs. shUbap2; ####, p < 0.0001 vs. shUbap2; and ††, p = 0.0079 vs. shCdh1 for (b); **, p = 0.0040, p = 0.0012, and p = 0.0081 vs. shCont; ***p = 0.0002 vs. shCont; ****p < 0.0001 vs. shCont; #, p = 0.0199 vs. shUbap2; ####, p < 0.0001 vs. shUbap2; and †, p = 0.0386 vs. shFosl1 for (c). d, e mRNA expression levels of CDH1 and FOSL1 in bone marrow-derived buffy coats from the normal postmenopausal woman controls (n = 15) and postmenopausal women with osteoporosis (n = 15). The minimum to maximum values and median values are shown in box and whisker plots. Exact p-values of an unpaired two-tailed t-test are shown. f Protein expression levels of E-cadherin and Fra1 in bone marrow-derived buffy coats from controls and patients with osteoporosis. The protein levels of E-cadherin, Fra1, and β-actin were analyzed by western blotting. The intensity for quantitative analysis was normalized to β-actin using Image Processing and Analysis in Java (Image J) software [http://imagej.nih.gov/ij/]. Source data are provided as a Source Data file. |