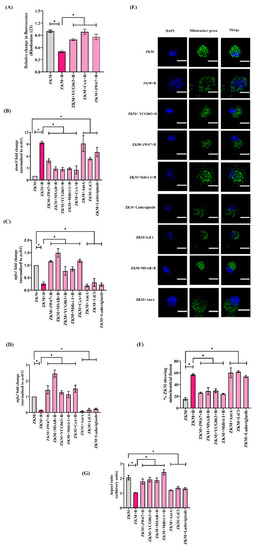
β-catenin-induced mtROS prompts ΔΨm loss leading to Drp1-mediated mitochondrial fission in A. hydrophila-infected ZKM. (A) ZKM pre-treated with or without the mtROS inhibitor (YCG063), MPTP inhibitor (CsA), and β-catenin inhibitor (JW67) for 1 h were infected with A. hydrophila, and relative changes in the ΔΨm were recorded at 12 h p.i. using rhodamine 123. (B–D) ZKM pre-treated with or without the β-catenin inhibitors (JW67 and MSAB), mtROS inhibitor (YCG063), Drp1 inhibitor (Mdivi-1), and MPTP inhibitor (CsA) for 1 h were infected with A. hydrophila, and at 12 h p.i., dnm1l, mfn1, and mfn2 mRNA expression analysis were performed using RT-qPCR. Additionally, ZKM were incubated with canonical Wnt/β-catenin pathway activators (LiCl and Laduviglusib) and Ant A for 1 h, and at 12 h p.i., dnm1l, mfn1, and mfn2 mRNA expression analysis were performed using RT-qPCR. (E) ZKM pre-treated with or without the β-catenin inhibitors (JW67 and MSAB), mtROS inhibitor (YCG063), and Drp1 inhibitor (Mdivi-1) for 1 h were infected with A. hydrophila, and the morphology of the mitochondrial network was examined at 12 h p.i. ZKM were washed, stained with MitoTracker green and DAPI, mounted and visualized under microscope (scale-5 µm). Similarly, ZKM were incubated with canonical Wnt/β-catenin pathway activators (LiCl and Laduviglusib) and Ant A and at 12 h p.i., and the morphology of the mitochondrial network was studied at 12 h p.i. Fluorescence microscopic data are representative of three independent experiments. (F) Quantification of the percentage of ZKM displaying fragmented mitochondria at 12 h p.i. with or without the pre-treatment of the indicated inhibitors and agonists. Data represents the cumulative result of three independent analyses. (G) Quantitative analysis of the aspect ratio in ZKM with or without the pre-treatment of the indicated inhibitors and agonists at 12 h p.i. Data represents the cumulative results of three independent analyses (20 ZKM per experiment). Vertical bars denote the mean ± SEM (n = 3). Asterisk (*) denotes a significant difference between the indicated groups (* p < 0.05). “+B” mentioned in the X-axis and microscopy images represents “+A. hydrophila”.
|
