A. hydrophila-infected ZKM show MOI-dependent death. ZKM were infected with an indicated MOI (ZKM:bacteria) and % ZKM cytotoxicity was enumerated at 24 h p.i. using 0.4% trypan blue dye exclusion method. At least 100 cells per field were observed for determining the % ZKM cytotoxicity. Vertical bars denote the mean ± SEM (n = 3). Asterisk (*) denotes the significant difference compared to the control (* p < 0.05).

A. hydrophila-induced ZKM death is apoptotic in nature. (A) ZKM pre-treated with or without the caspase-3 inhibitor (Ac-DEVD-CHO) were infected with A. hydrophila (MOI 1:50), and apoptosis was assessed by enumerating Hoechst-positive ZKM at 24 h p.i., A(i), A(ii), and A(iii) represent the uninfected ZKM, A. hydrophila-infected ZKM, and A. hydrophila-infected ZKM pre-treated with Ac-DEVD-CHO, respectively, at 24 h p.i. (×40). Three different fields having at least 100 cells were observed for determining the percentage of Hoechst-positive ZKM. (B) B(i) represents uninfected ZKM, B(ii) A. hydrophila-infected ZKM, and B(iii) A. hydrophila-infected ZKM pre-treated with the caspase-3 inhibitor (Ac-DEVD-CHO), respectively, were stained with AV-PI at 24 h p.i., and photomicrographs were captured using the fluorescence microscope (×40). Three different fields having at least 100 cells were observed for determining the percentages of AV+PI+, AVPI+, and AV+PI- cells. (C) Uninfected and A. hydrophila-infected ZKM were lysed at 24 h p.i., with their gDNA then isolated and subjected to agarose gel electrophoresis alongside the 100 bp DNA marker. (D) ZKM were infected with A. hydrophila, and relative caspase-3 activity was measured at indicated time points p.i. Vertical bars denote the mean ± SEM (n = 3). Asterisk (*) and hash (#) denote a significant difference between the indicated groups (* p < 0.05). “+B” mentioned in the X-axis represents “+A. hydrophila”.

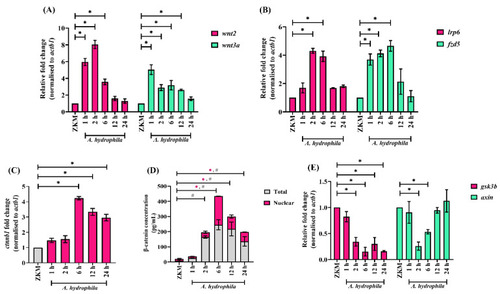
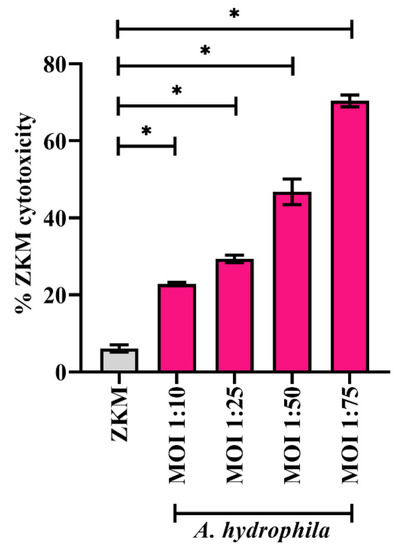
Canonical Wnt signaling is activated in A. hydrophila-infected ZKM. ZKM were infected with A. hydrophila, and at indicated time points p.i., mRNA expression analysis was conducted for (A) wnt2 and wnt3a, (B) lrp6 and fzd5, (C) ctnnb1, and (E) gsk3b and axin using RT-qPCR. (D) ZKM were infected with A. hydrophila, and at indicated time points p.i., total β-catenin and nuclear β-catenin protein levels were quantified. Vertical bars represent the mean ± SEM (n = 3). Asterisk (*) and hash (#) denote the significant difference compared to the control (* p < 0.05).

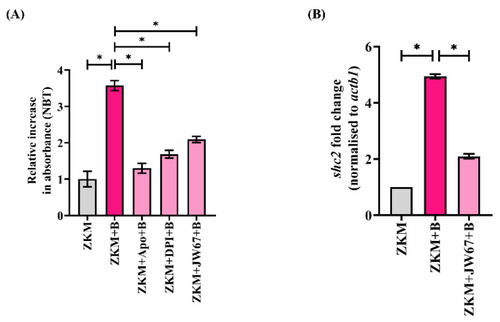
β-catenin triggers NOX-induced ROS production and upregulates shc2 mRNA expression. (A) ZKM pre-treated with or without NOX inhibitors (Apo and DPI) and β-catenin inhibitor (JW67) for 1 h were infected with A. hydrophila, and superoxide levels were measured using the NBT assay at 6 h p.i., and (B) ZKM pre-treated with or without JW67 for 1 h were infected with A. hydrophila, and shc2 mRNA expression was analyzed with RT-qPCR at 6 h p.i. Vertical bars represent the mean ± SEM (n = 3). Asterisk (*) denotes a significant difference between the indicated groups (* p < 0.05). “+B” mentioned in the X-axis represents “+A. hydrophila”.

β-catenin triggers ROS-induced-mtROS generation and downregulates sod2 mRNA expression. ZKM pre-treated with or without β-catenin inhibitors (JW67 and MSAB), NOX inhibitors (Apo and DPI), and mtROS inhibitor (YCG063) for 1 h were infected with A. hydrophila, and at 12 h p.i., (A) changes in mtROS levels were measured with fluorimetry, and (B) changes in mtROS levels were visualized under the fluorescence microscope. Fluorescence microscopic data are representative of three independent experiments. Ant A was used as a positive control. Additionally, ZKM were incubated with canonical Wnt/β-catenin pathway activators (LiCl and Laduviglusib), and changes in mtROS levels were measured with both fluorimetry and fluorescence microscopy. (C) ZKM pre-treated with or without the β-catenin inhibitor (JW67) were infected with A. hydrophila and sod2 mRNA expression was analyzed with RT-qPCR at 12 h p.i. Vertical bars denote the mean ± SEM (n = 3). Asterisk (*) denotes a significant difference between the indicated groups (* p < 0.05). “+B” mentioned in the X-axis and microscopy images represents “+A. hydrophila”.

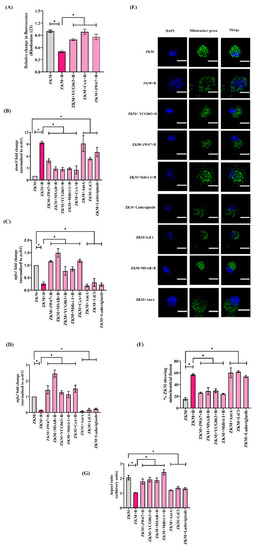
β-catenin-induced mtROS prompts ΔΨm loss leading to Drp1-mediated mitochondrial fission in A. hydrophila-infected ZKM. (A) ZKM pre-treated with or without the mtROS inhibitor (YCG063), MPTP inhibitor (CsA), and β-catenin inhibitor (JW67) for 1 h were infected with A. hydrophila, and relative changes in the ΔΨm were recorded at 12 h p.i. using rhodamine 123. (BD) ZKM pre-treated with or without the β-catenin inhibitors (JW67 and MSAB), mtROS inhibitor (YCG063), Drp1 inhibitor (Mdivi-1), and MPTP inhibitor (CsA) for 1 h were infected with A. hydrophila, and at 12 h p.i., dnm1l, mfn1, and mfn2 mRNA expression analysis were performed using RT-qPCR. Additionally, ZKM were incubated with canonical Wnt/β-catenin pathway activators (LiCl and Laduviglusib) and Ant A for 1 h, and at 12 h p.i., dnm1l, mfn1, and mfn2 mRNA expression analysis were performed using RT-qPCR. (E) ZKM pre-treated with or without the β-catenin inhibitors (JW67 and MSAB), mtROS inhibitor (YCG063), and Drp1 inhibitor (Mdivi-1) for 1 h were infected with A. hydrophila, and the morphology of the mitochondrial network was examined at 12 h p.i. ZKM were washed, stained with MitoTracker green and DAPI, mounted and visualized under microscope (scale-5 µm). Similarly, ZKM were incubated with canonical Wnt/β-catenin pathway activators (LiCl and Laduviglusib) and Ant A and at 12 h p.i., and the morphology of the mitochondrial network was studied at 12 h p.i. Fluorescence microscopic data are representative of three independent experiments. (F) Quantification of the percentage of ZKM displaying fragmented mitochondria at 12 h p.i. with or without the pre-treatment of the indicated inhibitors and agonists. Data represents the cumulative result of three independent analyses. (G) Quantitative analysis of the aspect ratio in ZKM with or without the pre-treatment of the indicated inhibitors and agonists at 12 h p.i. Data represents the cumulative results of three independent analyses (20 ZKM per experiment). Vertical bars denote the mean ± SEM (n = 3). Asterisk (*) denotes a significant difference between the indicated groups (* p < 0.05). “+B” mentioned in the X-axis and microscopy images represents “+A. hydrophila”.

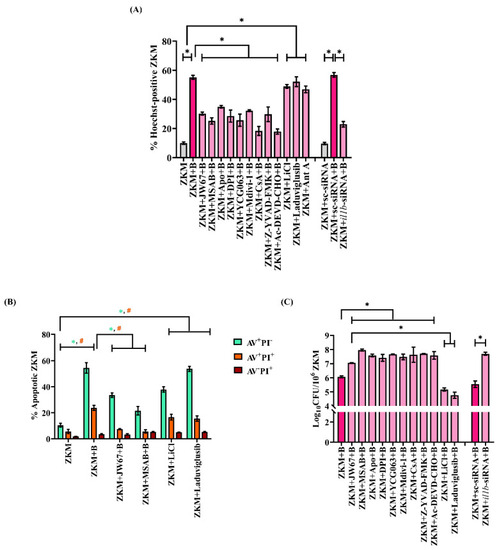
β-catenin plays a pro-apoptotic and anti-bacterial role in A. hydrophila-infected ZKM. (A) ZKM pre-treated with or without β-catenin inhibitors (JW67 and MSAB), NOX inhibitors (Apo and DPI), mtROS inhibitor (YCG063), Drp1 inhibitor (Mdivi-1), MPTP inhibitor (CsA), caspase-1 inhibitor (Z-YVAD-FMK), and caspase-3 inhibitor (Ac-DEVD-CHO) for 1 h or transfected with sc-siRNA, il1b-siRNA were infected with A. hydrophila, and % Hoechst-positive ZKM were enumerated at 24 h p.i. Additionally, ZKM were incubated with canonical Wnt/β-catenin pathway activators (LiCl and Laduviglusib) and Ant A for 1 h and % Hoechst-positive ZKM were enumerated at 24 h p.i. (B) ZKM pre-treated with or without β-catenin inhibitors (JW67 and MSAB) for 1 h were infected with A. hydrophila and stained with AV-PI at 24 h p.i. Next, % apoptotic ZKM were calculated. Similarly, ZKM were incubated with canonical Wnt/β-catenin pathway activators (LiCl and Laduviglusib) for 1 h and % Hoechst-positive ZKM were enumerated at 24 h p.i. (C) ZKMs pre-treated with or without β-catenin inhibitors (JW67 and MSAB), NOX inhibitors (Apo and DPI), mtROS inhibitor (YCG063), Drp1 inhibitor (Mdivi-1), MPTP inhibitor (CsA), caspase-1 inhibitor (Z-YVAD-FMK), and caspase-3 inhibitor (Ac-DEVD-CHO) for 1 h or transfected with sc-siRNA, il1b-siRNA were infected with A. hydrophila and the bacterial loads were enumerated at 24 h p.i. Additionally, ZKM were incubated with canonical Wnt/β-catenin pathway activators (LiCl and Laduviglusib) and Ant A for 1 h and % Hoechst-positive ZKM were enumerated at 24 h p.i. Vertical bars represent the mean ± SEM (n = 3). Asterisk (*) and hash (#) denote a significant difference between the indicated groups (* p < 0.05). “+B” mentioned in the X-axis represents “+A. hydrophila”.

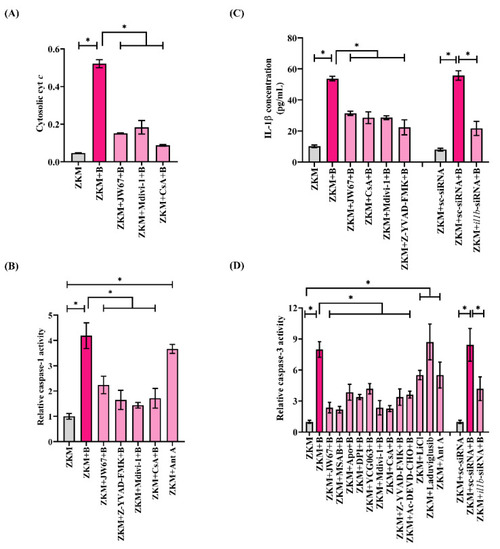
β-catenin-induced mitochondrial fission triggers cyt c release, activating the caspase-1/IL-1β/caspase-3 axis in A. hydrophila-infected ZKM. (A) ZKM pre-treated with or without β-catenin inhibitor (JW67), Drp1 inhibitor (Mdivi-1), and MPTP inhibitor (CsA) for 1 h were infected with A. hydrophila, and changes in cytosolic cyt c were studied at 12 h p.i. (B) ZKM pre-treated with β-catenin inhibitor (JW67), caspase-1 inhibitor (Z-YVAD-FMK), Drp1 inhibitor (Mdivi-1), and MPTP inhibitor (CsA) for 1 h were infected with A. hydrophila, and relative changes in caspase-1 activity were studied at 12 h p.i. mtROS inducer (Ant A) was used as a positive control in this study. (C) ZKM pre-treated with β-catenin inhibitor (JW67), MPTP inhibitor (CsA), Drp1 inhibitor (Mdivi-1), and caspase-1 inhibitor (Z-YVAD-FMK) for 1 h or transfected with sc-siRNA, il1b-siRNA were infected with A. hydrophila, and relative changes in IL-1β concentration were plotted at 12 h p.i. (D) ZKM pre-treated with or without β-catenin inhibitors (JW67 and MSAB), NOX inhibitors (Apo and DPI), mtROS inhibitor (YCG063), Drp1 inhibitor (Mdivi-1), MPTP inhibitor (CsA), caspase-1 inhibitor (Z-YVAD-FMK), and caspase-3 inhibitor (Ac-DEVD-CHO) for 1 h or transfected with sc-siRNA, il1b-siRNA were infected with A. hydrophila, and relative changes in caspase-3 activity were studied at 24 h p.i. Additionally, ZKM were incubated with canonical Wnt/β-catenin pathway activators (LiCl and Laduviglusib) and Ant A, and relative changes in caspase-3 activity were studied at 24 h p.i. Vertical bars denote the mean ± SEM (n = 3). Asterisk (*) denotes a significant difference between the indicated groups (* p < 0.05). “+B” mentioned in the X-axis represents “+A. hydrophila”.

Overview of the study. Canonical Wnt signaling-induced NOX-mediated ROS triggers mtROS generation leading to downstream ΔΨm loss. ΔΨm loss prompts the activation of Drp1-mediated mitochondrial fission. Activated mitochondrial fission leads to cyt c release, which activates the caspase-1/IL-1β/caspase-3 axis, leading to apoptosis of the A. hydrophila-infected ZKM.

Acknowledgments
This image is the copyrighted work of the attributed author or publisher, and ZFIN has permission only to display this image to its users. Additional permissions should be obtained from the applicable author or publisher of the image. Full text @ Cells