
Figure 3
- ID
- ZDB-FIG-230515-6
- Publication
- Van Hall-Beauvais et al., 2022 - Z-REX uncovers a bifurcation in function of Keap1 paralogs
- Other Figures
- All Figure Page
- Back to All Figure Page
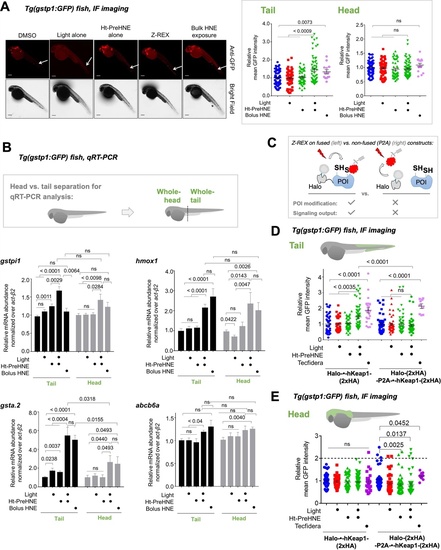
(A) Tg(gstp1:GFP) heterozygotes injected with Halo-•-hKeap1-(2xHA) mRNA at one- to four-cell stage. (See Appendix 1-Scheme 1 for workflow). Left: Representative IF-images of Tg(gstp1:GFP) fish 4 hr post Z-REX show an increase in GFP-signal intensity in the tail (arrows) subsequent to Z-REX-mediated Keap1-specific HNEylation. No AR activation was observed with all Z-REX controls (DMSO-treated, light alone, and Ht-PreHNE alone). [Note: GFP-expression was detected using red fluorescence because of high background signal in GFP (ex: 488 nm; em: 520–550 nm) channel]. Right: Image quantitation was performed on the head/tail-regions illustrated in Figure 1B. No. embryos analyzed: DMSO: No light (65), light (61); photocaged probe Ht-PreHNE: No light (47), with light (59); HNE (13). Also see Figure 1—figure supplements 1C and 2A, Figure 3—figure supplement 1. (B) Z-REX-targeted Keap1-specific HNEylation is sufficient to upregulate endogenous AR-genes represented by gstpi1, gsta.2, hmox1, and abcb6a (see Appendix). 2 hr post Z-REX or bolus HNE treatment, embryos were euthanized, RNA was isolated separately from head and tail and qRT-PCR analyses were performed as described in Methods. Inset above shows whole-head/-tail separation performed prior to RNA isolation. See, for workflow, Appendix 1-Scheme 1. n>4 independent biological replicates and 2 technical repeats for each sample. Also see Figure 1—figure supplement 2B. (C) Illustration of a ‘perfect’ negative control for Z-REX using the non-fused construct that allows Halo and POI (protein of interest) to be expressed separately in vivo. See text for discussions. Replicating T-REX/Z-REX using the non-fused construct (here, P2A construct) results in ablation of POI modification by LDE as well as ablation of downstream signaling that are otherwise observed using the fused Halo-POI construct. Also see Figure 3D–E and Figure 3—figure supplement 2. (D) Z-REX-mediated AR-upregulation in the tail is observed only in Halo-•-hKeap1-(2xHA)-fusion-protein-expressing fish embryos, but not in the non-fused construct [i.e. Halo-(2xHA)-P2A-•-hKeap1-(2xHA)-mRNA]-injected embryos (see Appendix for mRNA sequence). See also Figure 3C and Figure 3—figure supplement 2. Bolus treatment of embryos expressing either construct with Tecfidera (Figure 1—figure supplement 1B) results in AR-upregulation in the tail. Image quantitation was performed on the tail-regions as illustrated. No. embryos analyzed: Halo-•-hKeap1-(2xHA): DMSO (43), Light alone (29), Ht-PreHNE alone (47), Z-REX (58), and Tecfidera (24); Halo-(2xHA)-P2A-•-hKeap1-(2xHA): DMSO (55), Light alone (49), Ht-PreHNE alone (52), Z-REX (47), and Tecfidera (9). See also Figure 3—figure supplement 2B. (E) Z-REX-mediated-AR-upregulation is not observed in the head. The dashed line indicates the average level of AR-upregulation in the tail following bulk exposure to Tecfidera (Figure 1—figure supplement 1B). Image quantitation was performed on the head as illustrated. No. embryos analyzed: Halo-•-hKeap1-(2xHA): DMSO (43), Light alone (29), Ht-PreHNE alone (49), Z-REX (65), and Tecfidera (24); Halo-(2xHA)-P2A-•-hKeap1-(2xHA): DMSO (55), Light alone (48), Ht-PreHNE alone (54), Z-REX (49), and Tecfidera (10). All numerical data present mean ± sem. Numbers above the bars represent analysis by two-tailed t-tests.
|