
- Title
-
Z-REX uncovers a bifurcation in function of Keap1 paralogs
- Authors
- Van Hall-Beauvais, A., Poganik, J.R., Huang, K.T., Parvez, S., Zhao, Y., Lin, H.Y., Liu, X., Long, M.J.C., Aye, Y.
- Source
- Full text @ Elife
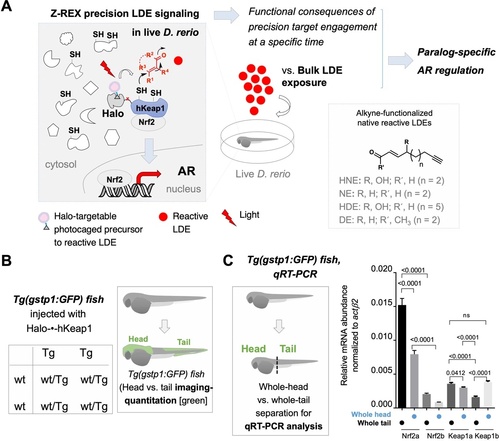
(A) This work investigates the biological impacts on druggable antioxidant response (AR) pathway at the organismal level following Z-REX-enabled hKeap1-specific electrophilic modification in live zebrafish embryos and compares these results to those obtained from bulk reactive electrophile exposure. In the process, novel paralog-specific regulation of AR was discovered. Inset, lower right: Structures of alkyne-functionalized lipid-derived electrophiles (LDEs). Unless otherwise specified, all LDEs deployed were alkyne-functionalized. See also Figure 1—figure supplement 1A. (B) Left: Punnett square denoting how cross of wild-type zebrafish with a transgenic strain (homozygous, or heterozygous, not shown) ensures that all transgenic progeny are heterozygous for the AR-reporter GFP-gene. Right: Using whole-mount immunofluorescence (IF) imaging, Tg(gstp1:GFP) heterozygotes were quantified separately for AR levels in head and tail regions indicated in green. Note: GFP expression was detected using immunofluorescence (IF) in fixed fish, analyzed by red fluorescence. The IF protocol is used because auto-fluorescence in the green channel is high in fish and prevents accurate quantitation and this avoids concerns regarding effects of electrophile on GFP fluorescence. (For whole-head/whole-tail separation in qRT-PCR analysis, see Figure 1C, inset). (C) Inset, left: Illustration for head vs. tail qRT-PCR analysis, where the fish were mechanically separated as marked by the dashed line. Right: The relative levels of mRNA of each paralog were assessed using qRT-PCR following physical separation of head and tail (see inset on left). Number of embryos analyzed: Head, all paralogs (6); Tail zKeap1a and zKeap1b (10), zNrf2a (5), zNrf2b (6). Note: these segments contain tissue other than the areas that express the AR-reporter GFP-gene. All numerical data present mean ± sem. Numbers above the bars represent analysis by two-tailed t-tests.
|
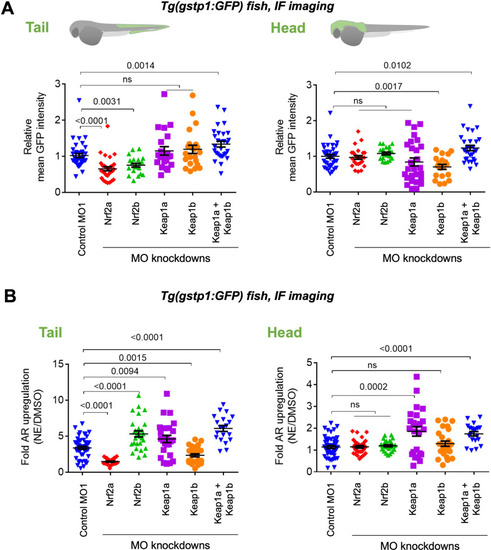
Homozygous Tg(gstp1:GFP) fish were crossed with wt fish. Resulting heterozygous embryos were injected with the stated morpholino (MO) at the 1- to four-cell stage. (See experimental Workflow in Appendix 1-Scheme 1). Image quantitation was performed on the head/tail-regions as illustrated. Note: GFP expression was detected using immunofluorescence (IF) in fixed fish, analyzed by red fluorescence. The IF protocol is used because auto-fluorescence in the green channel is high in fish and prevents accurate quantitation and IF avoids concerns regarding effects of electrophile on GFP fluorescence. ATG MOs used for single-MO injection, SPL MOs used for simultaneously knocking down zKeap1a and zKeap1b; see Figure 1—figure supplements 3–5 and Figure 2—figure supplements 1–2 for MO validations and Appendix for MO sequences. Also see Figure 1—figure supplements 1–5, Figure 2—figure supplements 1–2, Figure 3—figure supplement 1. (A) Quantitation of GFP expression (which indicates relative basal AR-levels) in the tail (left panel) and head (right) of Tg(gstp1:GFP) zebrafish larvae following MO-knockdown of the indicated zKeap1 and zNrf2 paralogs. No. embryos analyzed: Control MO (38), zNrf2a MO (32), zNrf2b MO (21), zKeap1a MO (21), zKeap1b MO (22), zKeap1a and zKeap1b MOs (29). (B) Quantitation of the relative fold change of AR level (GFP signal) in the tail (left panel) and head (right) following bulk electrophile (NE; see Figure 1A inset) exposure. No. embryos analyzed: Control MO (48), zNrf2a MO (27), zNrf2b MO (27), zKeap1a MO (24), zKeap1b MO (29), zKeap1a and zKeap1b MOs (20). All numerical data present mean ± sem. Numbers above the bars represent analysis by two-tailed t-tests.
|
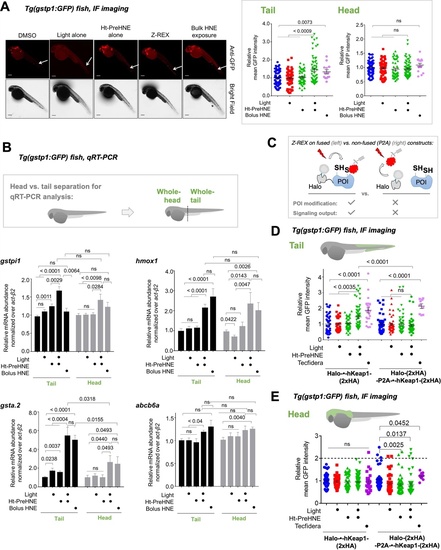
(A) Tg(gstp1:GFP) heterozygotes injected with Halo-•-hKeap1-(2xHA) mRNA at one- to four-cell stage. (See Appendix 1-Scheme 1 for workflow). Left: Representative IF-images of Tg(gstp1:GFP) fish 4 hr post Z-REX show an increase in GFP-signal intensity in the tail (arrows) subsequent to Z-REX-mediated Keap1-specific HNEylation. No AR activation was observed with all Z-REX controls (DMSO-treated, light alone, and Ht-PreHNE alone). [Note: GFP-expression was detected using red fluorescence because of high background signal in GFP (ex: 488 nm; em: 520–550 nm) channel]. Right: Image quantitation was performed on the head/tail-regions illustrated in Figure 1B. No. embryos analyzed: DMSO: No light (65), light (61); photocaged probe Ht-PreHNE: No light (47), with light (59); HNE (13). Also see Figure 1—figure supplements 1C and 2A, Figure 3—figure supplement 1. (B) Z-REX-targeted Keap1-specific HNEylation is sufficient to upregulate endogenous AR-genes represented by gstpi1, gsta.2, hmox1, and abcb6a (see Appendix). 2 hr post Z-REX or bolus HNE treatment, embryos were euthanized, RNA was isolated separately from head and tail and qRT-PCR analyses were performed as described in Methods. Inset above shows whole-head/-tail separation performed prior to RNA isolation. See, for workflow, Appendix 1-Scheme 1. n>4 independent biological replicates and 2 technical repeats for each sample. Also see Figure 1—figure supplement 2B. (C) Illustration of a ‘perfect’ negative control for Z-REX using the non-fused construct that allows Halo and POI (protein of interest) to be expressed separately in vivo. See text for discussions. Replicating T-REX/Z-REX using the non-fused construct (here, P2A construct) results in ablation of POI modification by LDE as well as ablation of downstream signaling that are otherwise observed using the fused Halo-POI construct. Also see Figure 3D–E and Figure 3—figure supplement 2. (D) Z-REX-mediated AR-upregulation in the tail is observed only in Halo-•-hKeap1-(2xHA)-fusion-protein-expressing fish embryos, but not in the non-fused construct [i.e. Halo-(2xHA)-P2A-•-hKeap1-(2xHA)-mRNA]-injected embryos (see Appendix for mRNA sequence). See also Figure 3C and Figure 3—figure supplement 2. Bolus treatment of embryos expressing either construct with Tecfidera (Figure 1—figure supplement 1B) results in AR-upregulation in the tail. Image quantitation was performed on the tail-regions as illustrated. No. embryos analyzed: Halo-•-hKeap1-(2xHA): DMSO (43), Light alone (29), Ht-PreHNE alone (47), Z-REX (58), and Tecfidera (24); Halo-(2xHA)-P2A-•-hKeap1-(2xHA): DMSO (55), Light alone (49), Ht-PreHNE alone (52), Z-REX (47), and Tecfidera (9). See also Figure 3—figure supplement 2B. (E) Z-REX-mediated-AR-upregulation is not observed in the head. The dashed line indicates the average level of AR-upregulation in the tail following bulk exposure to Tecfidera (Figure 1—figure supplement 1B). Image quantitation was performed on the head as illustrated. No. embryos analyzed: Halo-•-hKeap1-(2xHA): DMSO (43), Light alone (29), Ht-PreHNE alone (49), Z-REX (65), and Tecfidera (24); Halo-(2xHA)-P2A-•-hKeap1-(2xHA): DMSO (55), Light alone (48), Ht-PreHNE alone (54), Z-REX (49), and Tecfidera (10). All numerical data present mean ± sem. Numbers above the bars represent analysis by two-tailed t-tests.
|

Also see Figures 5–6 and Figure 3—figure supplement 1, Figure 3—figure supplements 3–5, Figure 4—figure supplement 1, Figure 5—figure supplement 1. (A) Quantitation of mean AR-levels in the tail of embryos 4 h post Z-REX with indicated LDEs. Image quantitation was performed on the tail-regions as illustrated. No. embryos analyzed: DMSO: No light (65), with light (84); Ht-PreHNE: No light (47), with light (59); Ht-PreHDE: No light (59), with light (59); Ht-PreNE: No light (38), with light (18); Ht-PreDE: No light (23), with light (22). (B) Similar quantitation in the head shows no increase in AR post Z-REX. Image quantitation was performed on the head-regions as illustrated. No. embryos analyzed: DMSO: No light (65), with light (82); Ht-PreHNE: No light (49), with light (65); Ht-PreHDE: No light (63), with light (60); Ht-PreNE: No light (38), with light (21); Ht-PreDE: No light (23), with light (22). (C) hKeap1-modification alone is sufficient to drive endogenous AR-gene upregulation in the tail in casper zebrafish. Whole-head/-tail separation was performed as indicated in inset (left), prior to RNA isolation selectively from the tails. 2 h post Z-REX with indicated LDEs, embryos were euthanized, and RNA was isolated, and qRT-PCR analyses were performed on tail samples (see inset, left) targeting indicated downstream genes (see Appendix for primer sequences). n>4 independent biological replicates and 2 technical repeats for each sample. Inset: schematic for fish separation. Note: tail was taken as a representative segment in these experiments. All numerical data present mean ± sem. Numbers above the bars represent analysis by two-tailed t-tests.
|
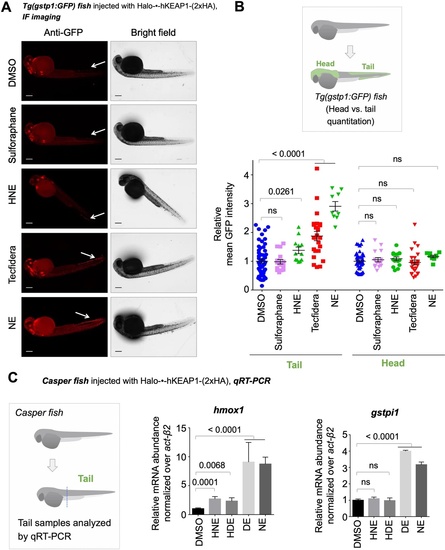
Also see Figure 6, Figure 3—figure supplements 1 and 4 and 5E, Figure 4—figure supplement 1, and Figure 5—figure supplement 1. (A) Representative IF images of Tg(gstp1:GFP) fish expressing Halo-•-hKeap1-(2xHA), following bolus exposure to indicated electrophiles. (B) Quantitation of data in (A). Image quantitation was performed on the head/tail-regions as illustrated. No. embryos analyzed: Tail, DMSO (55), Sulforaphane (16), HNE (12), Tecfidera (24), NE (9); Head, DMSO (43), Sulforaphane (16), HNE (15), Tecfidera (24), NE (9). Sulforaphane and HNE elicit non-significant and 1.5-fold AR upregulation, respectively. Tecfidera gives medium (~2-fold) AR response and NE elicits the strongest AR upregulation (~3-fold) in tail. Consistent with data elsewhere (e.g., Figure 3A and C-E), head is not responsive. (C) qRT-PCR analysis of endogenous AR-responsive genes following bolus exposure of native reactive LDEs to whole fish similarly shows mixed responses. Whole-head/-tail separation was performed as indicated in inset (left), prior to RNA isolation selectively from the tails. 2 hr post Z-REX, embryos were euthanized, and RNA was isolated separately from tail (see inset, left). Data are presented as mean ± sem. n>3 independent biological replicates and two technical repeats for each sample. All numerical data present mean ± sem. Numbers above the bars represent analysis by two-tailed t-tests.
|
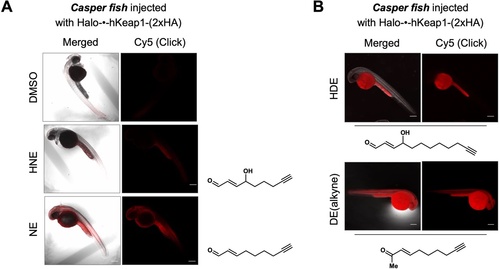
See also Figure 5—figure supplement 1. (A) Casper zebrafish were treated with indicated LDEs for 2 hr before euthanasia and fixing. See Methods for whole-reactive-proteome labeling procedure in fish using Click coupling. (B) Comparison of whole-reactive-proteome labeling extent of HDE and DE over time (2 hr) shows allylic alcohol motif within LDEs is likely responsible for reduced Keap1-labeling degree under bolus conditions.
|

Cell-based studies of zKeap1a and zKeap1b recapitulate the dominant-negative behavior observed in developing embryos; cell-based T-REX analysis (Figure 1—figure supplement 1A) reveal similar electrophile sensitivity across all Keap1-variants. See also Figure 8A–B, Figure 7—figure supplements 1–2 and Figure 8—figure supplement 1. (A) The nine cysteines within hKeap1 that are present in only one of the two Keap1 paralogs in zebrafish. (N-term, BTB, IVR, Kelch-Repeats, C-term are individual conserved domains of Keap1). All indicated cysteines are conserved between human and zebrafish Keap1. (B) HEK293T cells were transiently transfected to express indicated Halo-•-Keap1 constructs. (See Figure 1—figure supplement 1D, Figure 7—figure supplement 2A and D for validation of construct functionality). 36 hr post transfection, cells were treated with Ht-PreNE (10 µM, 2 hr), and after rinsing cycles, cells were then exposed to UV light (5 mW/cm2 365 nm lamp). Post lysis, samples were treated with TeV protease and subjected to Click coupling with Cy5-azide. The targeting efficiency of NE on each variant was calculated using a previously-reported procedure Parvez et al., 2016; Van Hall-Beauvais et al., 2018. See Figure 7—figure supplement 2B-C for representative in-gel fluorescence and western blot data. (C) HEK293T cells were transfected with plasmids encoding ARE:Firefly luciferase and CMV:Renilla Firefly reporters, human myc-Nrf2, and Keap1 (Halo-•-hKeap1, Halo-•-(3xFLAG)-zKeap1a, Halo-•-(3xFLAG)-zKeap1b, Halo-•-hKeap1 C273I, or empty vector). (See Figure 1—figure supplement 1D, Figure 7—figure supplement 2A and D for validation of construct functionality). Basal (non-electrophile-stimulated) AR levels were quantified using a standard procedure Parvez et al., 2016; Long et al., 2017b; Van Hall-Beauvais et al., 2018. The horizontal dotted line represents basal AR levels with no exogenous Keap1 introduction. All conditions show a significant drop compared to basal level (i.e. with no exogenous Keap1 overexpression). No. independent biological replicates: Halo-•-hKeap1 (n=65), Halo-•-hKeap1 C273I (n=63), Halo-•-(3xFLAG)-zKeap1a (n=19), Halo-•-(3xFLAG)-zKeap1b (n=19). These were all dosed at a plasmid loading equivalent to 100%. Also see Figure 7—figure supplement 2A and D. (D) HEK293T cells were transfected with a mixture of plasmids encoding Halo-•-(3xF)-zKeap1a and Halo-•-(3xF)-zKeap1b in various ratios this mix also contained empty vector as required, myc-Nrf2, and AR reporter plasmids, see (C) See Figure 1—figure supplement 1D, Figure 7—figure supplement 2A and D for validation of construct functionality. 36 hr post transfection, AR was measured using a standard procedure Parvez et al., 2016; Long et al., 2017b; Van Hall-Beauvais et al., 2018. The horizontal dotted line indicates the basal AR levels in the absence of exogenously-introduced Keap1. Percentages are relative to those analyzed in Figure 7—figure supplement 2D. No. independent biological replicates: n=22 for zKeap1a/b mixing, n=63 for WT/C273I hKeap1 mixing. (E) A similar experiment to (C) except AR in response to NE bolus dosing was measured in HEK293T cells transfected with: Halo-•-hKeap1(WT); Halo-•-(3xFLAG)-zKeap1b; Halo-•-hKeap1(C273I); and Halo-•-(3xFLAG)-zKeap1a. (See Figure 1—figure supplement 1D, Figure 7—figure supplement 2A and D for validation of construct functionality). The horizontal dotted line represents the normalized AR-level for respective Keap1-variants following DMSO-treatment in place of NE. No. independent biological replicates: hKeap1 WT (n=28), hKeap1 C273I (n=28), zKeap1a (n=20), zKeap1b (n=20). (F) A similar experiment to (D), except AR in response to NE bolus dosing was measured in HEK293T cells. (See Figure 1—figure supplement 1D, Figure 7—figure supplement 2A and D for validation of construct functionality). Note: the indicated mix of Halo-•-(3xFLAG)-zKeap1a and Halo-•-(3xFLAG)-zKeap1b upregulated AR to a similar extent as Halo-•-(3xFLAG)-zKeap1a alone. The horizontal dotted line represents the normalized AR-level for respective Keap1-variants following DMSO-treatment in place of NE. Percentages are relative to those described in Figure 7—figure supplement 2D. No. independent biological replicates: n=54 for zKeap1a/b mixing, n=20 for WT/C273I hKeap1 mixing. All numerical data present mean ± sem. Numbers above the bars represent analysis by two-tailed t-tests. |
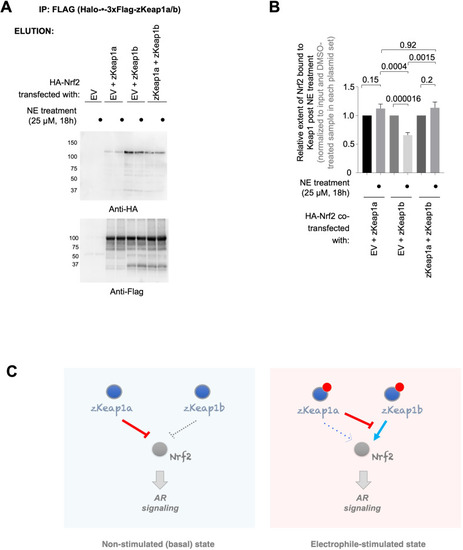
zKeap1a/b paralog-specific AR regulation is reflected by the differences in altered Nrf2 binding following electrophile stimulation. (A) HEK293T cells were transfected with a plasmid encoding HA-Nrf2 [used because anti-HA-antibody is orthogonal to our anti-FLAG-antibody; and because this anti-HA-antibody (for detecting HA-Nrf2) is of higher sensitivity, compared to anti-myc-antibody to myc-Nrf2], and (an)other plasmid(s) encoding: either a mix of Halo-•–3xFlag-zKeap1a and Halo-•–3xFlag-zKeap1b, Halo-•–3xFlag-zKeap1a and empty vector (EV), Halo-•–3xFlag-zKeap1b and EV, or EV alone. The plasmid amount of HA-Nrf2 was 50% in all co-transfection conditions, and the rest of the co-transfected plasmids made up the other 50% (with equal 1:1 or 1:1:1 contribution from each plasmid, as applicable). Following whole-cell NE treatment (25 µM, 18 hr), normalized cell lysates were treated with anti-Flag M2 resin to evaluate the relative extent of association between zKeap1a/b and Nrf2 following NE stimulation. Representative blots for Elution. The band around ~37 kDa in anti-Flag blot, although of unknown identity, is present almost equally in both ‘zKeap1b’ and ‘zKeap1b+zkeap1 a’ samples, and thus its presence cannot be sufficient to explain the differences observed between these two data sets. See Figure 8—figure supplement 1 for the corresponding Input. (B) Quantification of (A) normalized over input (see Figure 8—figure supplement 1) and corresponding DMSO-treated samples in each set. Right panel: Quantification for Nrf2 association to zKeap1 upon NE bolus treatment for different ratios of zKeap1a:zKeap1b. (n=6 biological replicates). (C) Proposed model illustrating paralog-specific nuanced regulation of cellular antioxidant response (AR) under steady-state vs. electrophile-stimulated conditions. Left panel: under non-electrophile-stimulated conditions, zKeap1a is a more effective antagonist of Nrf2 (and hence, AR-signaling) than zKeap1b. Right: following electrophile stimulation, zKeap1b-modification results in a large upregulation in AR through significantly-reduced binding of Nrf2. By contrast, zKeap1a-modification gives rise to a weaker AR-upregulation, and zKeap1a—likely in the electrophile-modified or -non-modified state—functions as a negative regulator to suppress Nrf2/AR-pathway activation promoted by modified-zKeap1b. See also Figure 8A–B and Figure 8—figure supplement 1. All numerical data present mean ± sem. Numbers above the bars represent analysis by two-tailed t-tests. |