
Figure 1
- ID
- ZDB-FIG-230515-5
- Publication
- Van Hall-Beauvais et al., 2022 - Z-REX uncovers a bifurcation in function of Keap1 paralogs
- Other Figures
- All Figure Page
- Back to All Figure Page
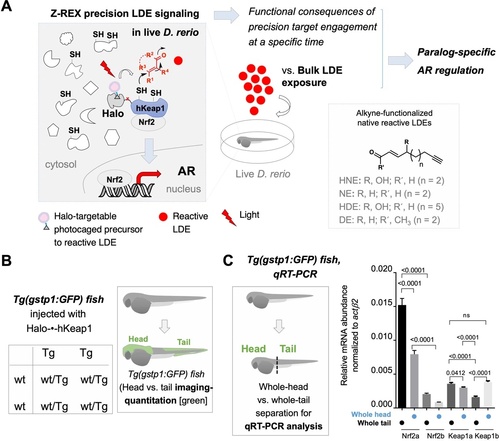
(A) This work investigates the biological impacts on druggable antioxidant response (AR) pathway at the organismal level following Z-REX-enabled hKeap1-specific electrophilic modification in live zebrafish embryos and compares these results to those obtained from bulk reactive electrophile exposure. In the process, novel paralog-specific regulation of AR was discovered. Inset, lower right: Structures of alkyne-functionalized lipid-derived electrophiles (LDEs). Unless otherwise specified, all LDEs deployed were alkyne-functionalized. See also Figure 1—figure supplement 1A. (B) Left: Punnett square denoting how cross of wild-type zebrafish with a transgenic strain (homozygous, or heterozygous, not shown) ensures that all transgenic progeny are heterozygous for the AR-reporter GFP-gene. Right: Using whole-mount immunofluorescence (IF) imaging, Tg(gstp1:GFP) heterozygotes were quantified separately for AR levels in head and tail regions indicated in green. Note: GFP expression was detected using immunofluorescence (IF) in fixed fish, analyzed by red fluorescence. The IF protocol is used because auto-fluorescence in the green channel is high in fish and prevents accurate quantitation and this avoids concerns regarding effects of electrophile on GFP fluorescence. (For whole-head/whole-tail separation in qRT-PCR analysis, see Figure 1C, inset). (C) Inset, left: Illustration for head vs. tail qRT-PCR analysis, where the fish were mechanically separated as marked by the dashed line. Right: The relative levels of mRNA of each paralog were assessed using qRT-PCR following physical separation of head and tail (see inset on left). Number of embryos analyzed: Head, all paralogs (6); Tail zKeap1a and zKeap1b (10), zNrf2a (5), zNrf2b (6). Note: these segments contain tissue other than the areas that express the AR-reporter GFP-gene. All numerical data present mean ± sem. Numbers above the bars represent analysis by two-tailed t-tests.
|