
Figure 2
- ID
- ZDB-FIG-221216-49
- Publication
- Van Hall-Beauvais et al., 2022 - Z-REX uncovers a bifurcation in function of Keap1 paralogs
- Other Figures
- All Figure Page
- Back to All Figure Page
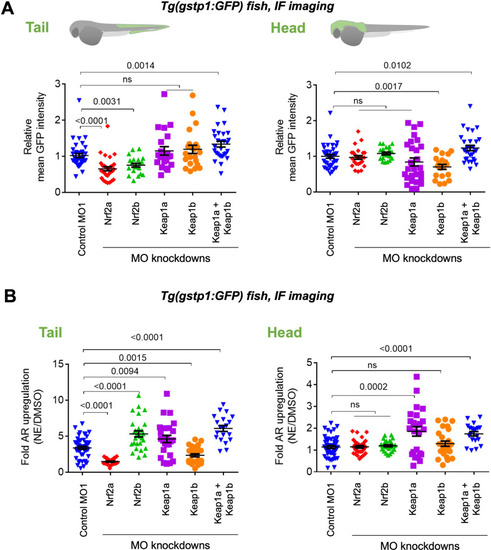
Homozygous Tg(gstp1:GFP) fish were crossed with wt fish. Resulting heterozygous embryos were injected with the stated morpholino (MO) at the 1- to four-cell stage. (See experimental Workflow in Appendix 1-Scheme 1). Image quantitation was performed on the head/tail-regions as illustrated. Note: GFP expression was detected using immunofluorescence (IF) in fixed fish, analyzed by red fluorescence. The IF protocol is used because auto-fluorescence in the green channel is high in fish and prevents accurate quantitation and IF avoids concerns regarding effects of electrophile on GFP fluorescence. ATG MOs used for single-MO injection, SPL MOs used for simultaneously knocking down zKeap1a and zKeap1b; see Figure 1—figure supplements 3–5 and Figure 2—figure supplements 1–2 for MO validations and Appendix for MO sequences. Also see Figure 1—figure supplements 1–5, Figure 2—figure supplements 1–2, Figure 3—figure supplement 1. (A) Quantitation of GFP expression (which indicates relative basal AR-levels) in the tail (left panel) and head (right) of Tg(gstp1:GFP) zebrafish larvae following MO-knockdown of the indicated zKeap1 and zNrf2 paralogs. No. embryos analyzed: Control MO (38), zNrf2a MO (32), zNrf2b MO (21), zKeap1a MO (21), zKeap1b MO (22), zKeap1a and zKeap1b MOs (29). (B) Quantitation of the relative fold change of AR level (GFP signal) in the tail (left panel) and head (right) following bulk electrophile (NE; see Figure 1A inset) exposure. No. embryos analyzed: Control MO (48), zNrf2a MO (27), zNrf2b MO (27), zKeap1a MO (24), zKeap1b MO (29), zKeap1a and zKeap1b MOs (20). All numerical data present mean ± sem. Numbers above the bars represent analysis by two-tailed t-tests.
|