
Fig. 6
- ID
- ZDB-FIG-230501-173
- Publication
- Yang et al., 2022 - Heterogeneities of zebrafish vasculature development studied by a high throughput light-sheet flow imaging system
- Other Figures
- All Figure Page
- Back to All Figure Page
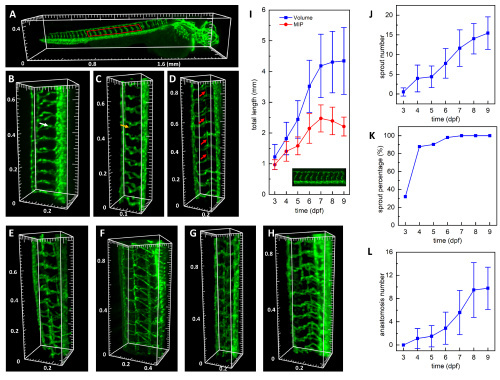
Development process of zebrafish trunk vessels from 3 to 9 dpf. (A) A typical whole larva 3D image at 3 dpf with a red box indicating the trunk vessels at the yolk extension region. See also Visualization 4. (B–H) 3D render of representative trunk vessels from 3 dpf to 9 dpf, respectively. White, yellow, and red arrows indicate the ISV, the sprouting, and anastomosis of the secondary sprout vessel, respectively. (I) The total length of ISVs at the yolk extension region measured from the 3D volume data (blue) and the 2D MIP (red). (J) Number of ISVs with the sprouted secondary vessel. (K) Percentage of larvae with the secondary sprout. (L) The number of anastomosed secondary sprout vessels. Error bars represent the corresponding standard deviation. |