
Fig. 3
- ID
- ZDB-FIG-230501-170
- Publication
- Yang et al., 2022 - Heterogeneities of zebrafish vasculature development studied by a high throughput light-sheet flow imaging system
- Other Figures
- All Figure Page
- Back to All Figure Page
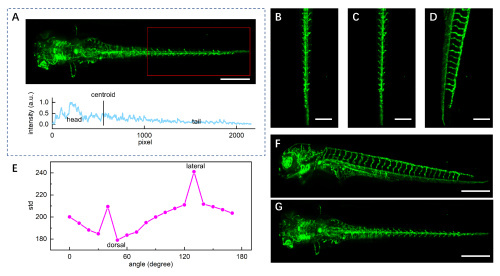
Auto registration of the 3D zebrafish vasculature structure. (A) A typical MIP image of a 3D structure obtained by LS-FIS and the corresponding intensity profile to determine the direction of the head. (B–D) MIP image of the tail region (red box in A) with three different rotation angles. (E) Variances of the serial MIP images with different rotation angles. The peak indicates the rotation angle in lateral view; the minimum indicates the rotation angle in dorsal view. (F, G) Registered MIP images of lateral (F) and dorsal (G) views for the whole zebrafish embryo. Scale bars represent 400 µm for (A, F, G) and 200 µm for (B, C, D), respectively. |