
Fig. 2
- ID
- ZDB-FIG-230501-169
- Publication
- Yang et al., 2022 - Heterogeneities of zebrafish vasculature development studied by a high throughput light-sheet flow imaging system
- Other Figures
- All Figure Page
- Back to All Figure Page
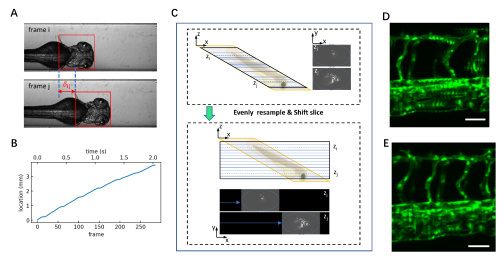
3D image reconstruction with corrected translational distance and image shift. (A) Bright-field images captured by CAM2 to calibrate the embryo movement driven by the flow. Template matching (red box) is applied to determine the translational distance. (B) The calculated translational location of the embryo at each frame in an LS-FIS imaging sequence. (C) 3D reconstruction by resampling along z-axis to a constant distance of 3.99 μm and applying a shift along x-axis between adjacent frames for the 3D light-sheet data. (D) MIP image of an original 3D volume obtained without the correction of translational distance. (E) MIP image from the same set 3D image data with the correction of translational distance. Scale bars represent 50 μm for (D) and (E). |