
FIGURE
Fig. 2
- ID
- ZDB-FIG-230421-11
- Publication
- Balamurugan et al., 2022 - Protocol to evaluate hyperlipidemia in zebrafish larvae
- Other Figures
- All Figure Page
- Back to All Figure Page
Fig. 2
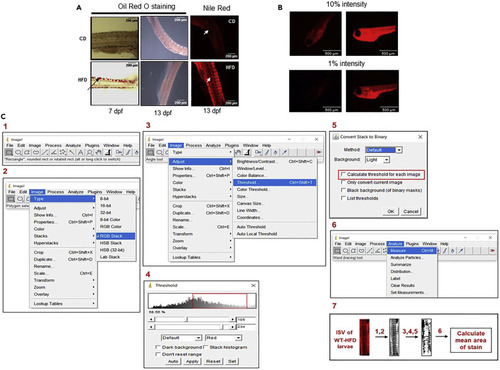
Comparative analysis of Oil Red O versus Nile red staining and flowchart of ImageJ quantification of inter-segmental vessels in HFD-fed zebrafish larvae (A) Oil Red O and Nile red staining of zebrafish larvae fed with control diet (CD) or High Fat Diet (HFD) for 7 or 13 days. (B) Nile red staining of zebrafish larvae at different light intensities. Left panels: control diet; Right Panels: HFD-fed. (C) Workflow for ImageJ based quantification of lipid accmulation in the inter-segmental vessels (ISV) of HFD-fed zebrafish larvae. |
Expression Data
Expression Detail
Antibody Labeling
Phenotype Data
Phenotype Detail
Acknowledgments
This image is the copyrighted work of the attributed author or publisher, and
ZFIN has permission only to display this image to its users.
Additional permissions should be obtained from the applicable author or publisher of the image.
Full text @ STAR Protoc