
- Title
-
Protocol to evaluate hyperlipidemia in zebrafish larvae
- Authors
- Balamurugan, K., Medishetti, R., Rao, P., K, R.V., Chatti, K., Parsa, K.V.L.
- Source
- Full text @ STAR Protoc

Oil Red O and Nile red staining protocol of HFD-fed zebrafish larvae |
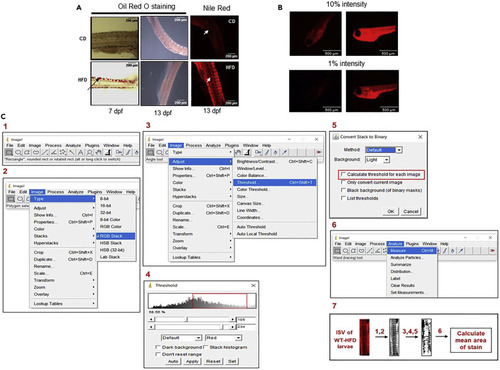
Comparative analysis of Oil Red O versus Nile red staining and flowchart of ImageJ quantification of inter-segmental vessels in HFD-fed zebrafish larvae (A) Oil Red O and Nile red staining of zebrafish larvae fed with control diet (CD) or High Fat Diet (HFD) for 7 or 13 days. (B) Nile red staining of zebrafish larvae at different light intensities. Left panels: control diet; Right Panels: HFD-fed. (C) Workflow for ImageJ based quantification of lipid accmulation in the inter-segmental vessels (ISV) of HFD-fed zebrafish larvae. |
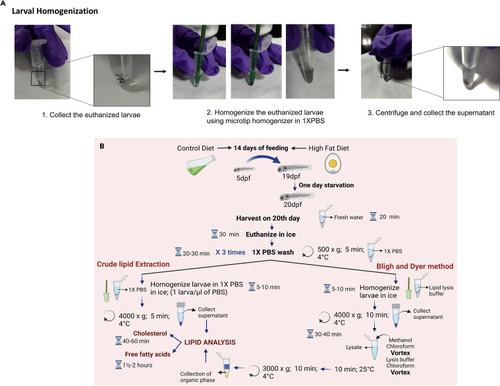
Larval homogenization, schematic representation of lipid extraction and cholesterol/free fatty acid analysis in zebrafish larval model of lipid accumulation (A) Picture guided workflow for the homogenization of zebrafish larvae. (B) Flowchart depiciting the steps involved in lipid extraction and analysis of cholesterol and free fatty acids in zebrafish larvae. |

Pictorial depiction of cholesterol and free fatty acid estimation in HFD-fed zebrafish larvae |
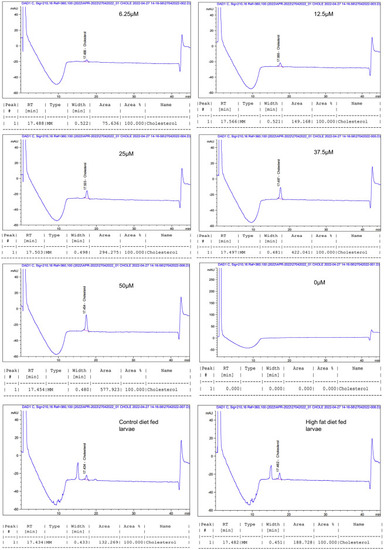
HPLC chromatograms of cholesterol standards and 15 dpf zebrafish larval samples |
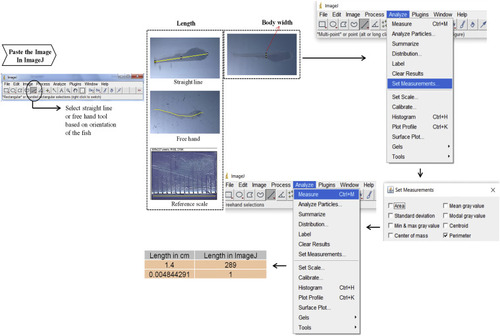
Flowchart for ImageJ-based length and width measurement of zebrafish larvae |