
Figure 2
- ID
- ZDB-FIG-230406-54
- Publication
- Li et al., 2023 - Copper overload impairs hematopoietic stem and progenitor cell proliferation via prompting HSF1/SP1 aggregation and the subsequently downregulating FOXM1-Cytoskeleton axis
- Other Figures
- All Figure Page
- Back to All Figure Page
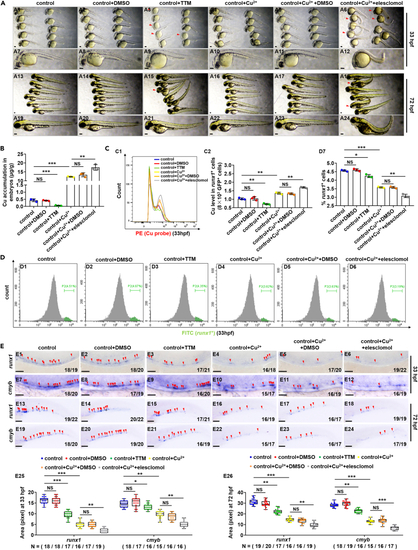
Cu chelator TTM and ionophore elesclomol affect embryonic and HSPC development during zebrafish embryogenesis (A) Phenotypes of zebrafish embryos in the control, DMSO exposed, TTM exposed, Cu exposed, Cu and DMSO co-exposed, or Cu and elesclomol co-exposed group, at 33 hpf and 72 hpf, respectively. (B) Cu concentration in zebrafish embryos from the control, DMSO exposed, TTM exposed, Cu exposed, Cu and DMSO co-exposed, or Cu and elesclomol co-exposed group at 33 hpf, respectively. (C) Cu content in individual runx1GFP+ cells (HSPCs) of zebrafish embryos in control, DMSO exposed, TTM exposed, Cu exposed, Cu and DMSO co-exposed, or Cu and elesclomol co-exposed group at 33 hpf, respectively. C1, flow cytometry (FACS) histogram; C2, calculation of Cu level in individual runx1GFP+ cells. (D) The percentage of runx1GFP+ cells in runx1:GFP embryos from different groups at 33 hpf, respectively. D1-D6, flow cytometry (FACS) histogram; D7, calculation of the percentage of runx1GFP+ cells in different groups. (E) The expression of HSPC genes runx1 and cmyb in embryos from different groups at 33 hpf and 72 hpf. E25, E26, calculation of runx1 and cmyb expression level in embryos from different groups, respectively. A1-A24, E1-E24, lateral view, anterior to the left, and dorsal to the up. Data are mean ± SD. t-test, ∗p < 0.05, ∗∗p < 0.01, ∗∗∗p < 0.001. NS, not significant. Scale bars, 50 μm (E1-E12), 100 μm (A1-A24) and 200 μm (E13-E24). |