
Figure 1
- ID
- ZDB-FIG-230406-53
- Publication
- Li et al., 2023 - Copper overload impairs hematopoietic stem and progenitor cell proliferation via prompting HSF1/SP1 aggregation and the subsequently downregulating FOXM1-Cytoskeleton axis
- Other Figures
- All Figure Page
- Back to All Figure Page
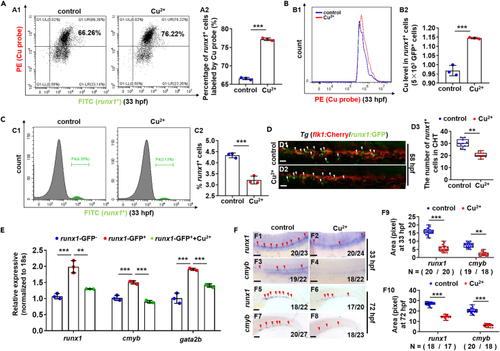
Accumulation of Cu in hematopoietic stem and progenitor cells (HSPCs) and the emergence and proliferation of HSPCs in Cu-stressed embryos (A and B) Proportion of HSPCs labeled with Cu probe (A) and the Cu content in individual runx1GFP+ cells (HSPCs) (B) were increased in Cu-stressed embryos at 33 hpf. A1, flow cytometry (FACS) plots; B1, flow cytometry (FACS) histogram; A2, calculation of the percentage of runx1GFP+ cells labeled by Cu probe; B2, calculation of Cu level in individual runx1GFP+ cells. (C) The percentage of runx1GFP+ cells in runx1:GFP embryos at 33 hpf. C1, flow cytometry (FACS) histogram; C2, calculation of the percentage of runx1GFP+ cells in different groups. (D) Cu-stressed flk1:Cherry/runx1:GFP embryos (D2) and the controls (D1) at 58 hpf. D3, calculation of runx1-positive cells (runx1+ cells). (E) The expression of HSPC genes runx1, cmyb, and gata2b in runx1GFP− cells, runx1GFP+ cells, and Cu-stressed runx1GFP+ cells, respectively. (F) The expression of HSPC genes runx1 and cmyb in embryos at 33 hpf and 72 hpf. F9, F10, calculation of runx1 and cmyb expression level in the Cu-stressed and control embryos, respectively. Each experiment was repeated three times, and a representative result is shown. Nchanged/Ntotal in the right bottom corner of each panel indicates embryos with changed expression/total tested embryos, and N in calculation panels indicates the number of embryos with changed expression in each group. The same for the numbers in the following figures. F1-F8, lateral view, anterior to the left, and dorsal to the up. Data are mean ± SD. t-test, ∗p < 0.05, ∗∗p < 0.01, ∗∗∗p < 0.001. Scale bars, 20 μm (D1-D2), 50 μm (F1-F4), and 200 μm (F5-F8). |