
Figure 1—figure supplement 3.
- ID
- ZDB-FIG-230319-65
- Publication
- Chen et al., 2023 - Granger causality analysis for calcium transients in neuronal networks, challenges and improvements
- Other Figures
-
- Figure 1—figure supplement 1.
- Figure 1—figure supplement 1.
- Figure 1—figure supplement 2.
- Figure 1—figure supplement 3.
- Figure 1—figure supplement 4.
- Figure 1—figure supplement 5.
- Figure 1—figure supplement 6.
- Figure 1—figure supplement 7.
- Figure 2—figure supplement 1.
- Figure 2—figure supplement 2.
- Figure 3—figure supplement 1.
- Figure 3—figure supplement 1.
- Figure 4—figure supplement 1.
- Figure 4—figure supplement 1.
- Figure 4—figure supplement 2.
- Figure 4—figure supplement 3.
- Figure 4—figure supplement 4.
- Figure 5.
- Figure 6.
- Figure 7.
- Figure 8—figure supplement 1.
- Figure 8—figure supplement 1.
- Figure 8—figure supplement 2.
- Figure 8—figure supplement 3.
- Figure 8—figure supplement 4.
- Figure 8—figure supplement 5.
- Figure 9.
- All Figure Page
- Back to All Figure Page
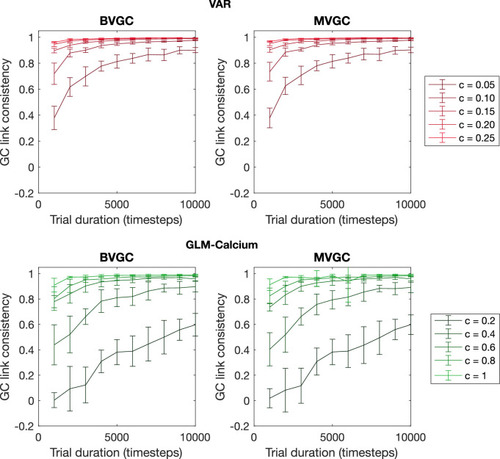
The consistency of GC values as a function of trial duration T and connection strength c for VAR dynamics simulated on random networks of N = 10 neurons. We measure the consistency of GC values using the Pearson’s correlation coefficient between GC values computed from two realizations of synthetic data generated using the same underlying dynamics. The consistency always improves with longer trial duration and stronger connection strength and is in general better for time series generated using VAR dynamics compared to the ones generated using the non-linear non-gaussian GLM-Calcium dynamics. Error bars are standard deviation across 10 random realizations of the network. |