FIGURE

Figure 6

ID
ZDB-FIG-230211-45
Publication
Bashirova et al., 2023 - A mechanistic understanding of the effects of polyethylene terephthalate nanoplastics in the zebrafish (Danio rerio) embryo
Other Figures
All Figure Page
Back to All Figure Page
Figure 6

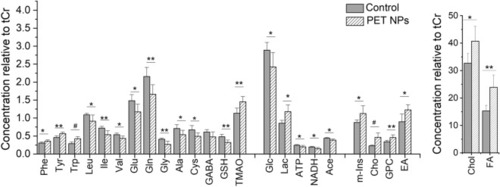
Effect of PET NPs treatment on the metabolic profile of intact zebrafish embryos. Zebrafish embryos (72 hpf) were exposed to 100 ppm PET NPs for 24 h. Concentrations of metabolites relative to total creatine (tCr) are shown. For statistical analysis, one-way ANOVA with a Tukey post-hoc correction for multiple comparisons were performed using OriginPro v. 8 (Northampton, MA, USA). Values shown are the mean ± standard deviation (n = 6). The statistically significant differences in metabolites between PET NPs treated and control group obtained by ANOVA analysis are indicated by # p < 0.001, ** p < 0.01 and * p < 0.05. Abbreviations: Phe = phenylalanine; Trp = tryptophan; Tyr = tyrosine; Leu = leucine, Ile = isoleucine; Val = valine; Glu = glutamate; Gln = glutamine; Gly = glycine; Ala = alanine; Cys = cysteine; GABA = g-aminobutyric acid; GSH = glutathione; TMAO = trimethylamine N-oxide; Glc = glucose; Lac = lactate; ATP = adenosine triphosphate; NADH = nicotinamide adenine dinucleotide; m-Ins = myo-inositol; Cho = choline; GPC = glycerophosphocholine; Chol = cholesterol; FA = fatty acids.

Expression Data

Expression Detail
Antibody Labeling
Phenotype Data

Phenotype Detail
Acknowledgments
This image is the copyrighted work of the attributed author or publisher, and ZFIN has permission only to display this image to its users. Additional permissions should be obtained from the applicable author or publisher of the image. Full text @ Sci. Rep.