FIGURE SUMMARY
Title

A mechanistic understanding of the effects of polyethylene terephthalate nanoplastics in the zebrafish (Danio rerio) embryo

Authors
Bashirova, N., Poppitz, D., Klüver, N., Scholz, S., Matysik, J., Alia, A.
Source
Full text @ Sci. Rep.

(A) Transmission electron microscopy (TEM) image (left) and high-angle annular dark-field scanning transmission electron microscopic (HAADF-STEM) image (right) (scale bar: 100 nm); (B) Hydrodynamic diameter distribution of PET NPs determined by dynamic light scattering; (C) ATR-FTIR spectra of water, PET NPs suspension and PET film.

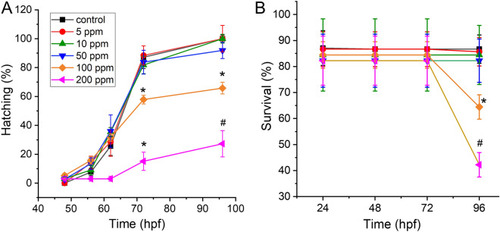
Effect of PET NPs on hatching (A) and survival rate (B) of zebrafish embryos. Embryos at 6 hpf were exposed to different concentrations (i.e., 0, 5, 10, 50, 100 and 200 ppm) of PET NPs for 24, 48, 72 and 96 h. Values shown are the mean ± standard deviation (n = 30 embryos per group). For statistical analysis, one-way ANOVA was performed using OriginPro v.8 (OriginLab, Northampton, MA, USA). The statistically significant differences in hatching and survival rate between PET NPs treated and control group obtained by ANOVA analysis are indicated by *p < 0.05 and # p < 0.01 as compared to untreated controls.

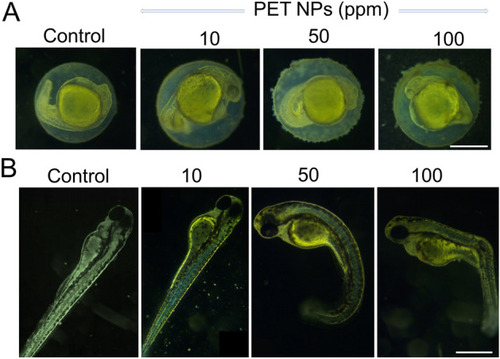
Representative images showing the effect of PET NPs on early stages of zebrafish embryo development. Embryos (6 hpf) were treated with different concentrations of PET NPs (0, 10, 50 and 100 ppm) for 24 h (A) and 72 h (B). After 72 h exposure to 100 ppm PET NPs, approximately 6–8% of the embryos show deformities including malformation of lateral curvature in spine similar to scoliosis, bending of the tail and bending of the body after treatment with PET. Scale bar: 0.5 mm in (A) and 1 mm in (B).

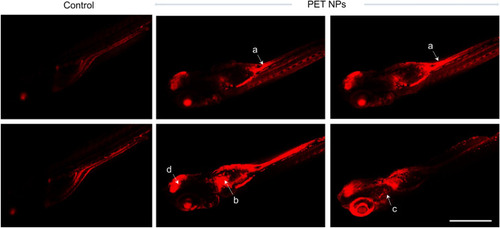
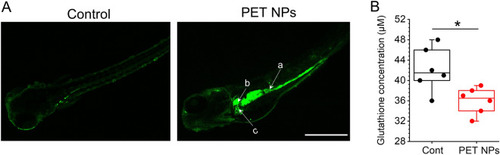
Representative Fluorescent confocal images (successive slices) showing the distribution of PET-NR nanoparticles in the body of zebrafish embryos (96 hpf) that were exposed to 100 ppm PET-NR nanoparticles for 24 h as compared to embryos treated with only NR (control). As can be noticed, nanoparticles are accumulated at various locations including intestine (a), pronephric duct/kidney (b), liver (c) and brain. Images were acquired using inverted laser-scanning confocal microscope (Leica DMi8 / TL LED, Leica Microsystems CMS GmbH). Scale bar: 1 mm.

(A) Representative high-resolution magic angle spin (HRMAS) NMR spectra of control and PET NPs (100 ppm) exposed zebrafish embryos. 72 hpf zebrafish embryos were treated with PET NPs for 24 h. Red arrows indicate an increase and decrease of metabolites. Abbreviations: Ala = alanine; Asn = aspargine; Asp = Aspartate; ADP = adenosinediphosphate; ATP = adenosinetriphosphate; Cho = choline; Chol = cholesterol; EA = Ethanolamine; FA = fatty acid; GABA = γ-aminobutyric acid; Gln = glutamine; Glu = glutamate; Gly = glycine; GPC = glycerophosphocholine; GSH = glutathione; Lac = lactate; m-Ins = myo-inositol; NAA = N-acetylaspartate; NADH/NAD +  = reduced/oxidized nicotinamide adenine dinucleotide; Phe = phenylalanine; Tau = Taurine; tCr = total creatin; Trp = tryptophan; Tyr = tyrosine; TMAO = trimethylamine N-oxide. (B) Multivariate analysis of the HRMAS NMR spectra (n = 6 per group) using orthogonal partial least square-discriminant analysis (PLS-DA) modelling (R2 = 0.998, Q2 = 0.962). (upper) Scores plots (PLS-DA1 vs PLS-DA2). The score plot explains 64% of total variance of control clustering in the positive PLS-DA2 scores, and PET in the negative PLS-DA2 scores. (lower) Loading plots of PLS-DA1 for all buckets containing assigned peaks.

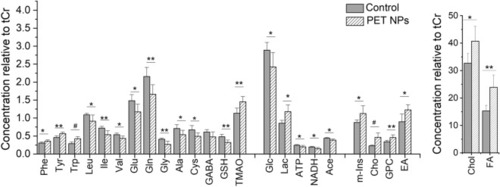
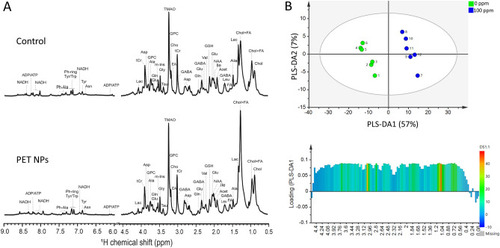
Effect of PET NPs treatment on the metabolic profile of intact zebrafish embryos. Zebrafish embryos (72 hpf) were exposed to 100 ppm PET NPs for 24 h. Concentrations of metabolites relative to total creatine (tCr) are shown. For statistical analysis, one-way ANOVA with a Tukey post-hoc correction for multiple comparisons were performed using OriginPro v. 8 (Northampton, MA, USA). Values shown are the mean ± standard deviation (n = 6). The statistically significant differences in metabolites between PET NPs treated and control group obtained by ANOVA analysis are indicated by # p < 0.001, ** p < 0.01 and * p < 0.05. Abbreviations: Phe = phenylalanine; Trp = tryptophan; Tyr = tyrosine; Leu = leucine, Ile = isoleucine; Val = valine; Glu = glutamate; Gln = glutamine; Gly = glycine; Ala = alanine; Cys = cysteine; GABA = g-aminobutyric acid; GSH = glutathione; TMAO = trimethylamine N-oxide; Glc = glucose; Lac = lactate; ATP = adenosine triphosphate; NADH = nicotinamide adenine dinucleotide; m-Ins = myo-inositol; Cho = choline; GPC = glycerophosphocholine; Chol = cholesterol; FA = fatty acids.

(A) Localization of reactive oxygen species (ROS) production in zebrafish embryos exposed to PET NPs (100 ppm) as compared to control embryos. Embryos (96 hpf which were already treated with PET for 24 h) were incubated for 60 min in CM-H2DCFA (10 μM) in rearing medium. Fluorescence detected in different regions of PET NPs treated embryos including (a) Intestine), (b) gall bladder and (c) liver. Scale bar: 1 mm. (B) Glutathione levels in extracts of zebrafish embryos (72 hpf) exposed to PET NPs (100 ppm for 24 h) as compared to control (Cont) embryos. Glutathione (GSH) levels were analysed by using GSH assay kit from Sigma-Aldrich. Significant reduction of GSH (*p < 0.05; n = 6) in PET NPs-treated embryo is clearly observed.

Acknowledgments
This image is the copyrighted work of the attributed author or publisher, and ZFIN has permission only to display this image to its users. Additional permissions should be obtained from the applicable author or publisher of the image. Full text @ Sci. Rep.