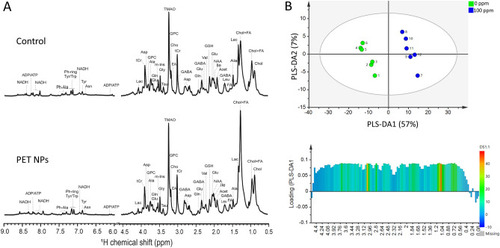
(A) Representative high-resolution magic angle spin (HRMAS) NMR spectra of control and PET NPs (100 ppm) exposed zebrafish embryos. 72 hpf zebrafish embryos were treated with PET NPs for 24 h. Red arrows indicate an increase and decrease of metabolites. Abbreviations: Ala = alanine; Asn = aspargine; Asp = Aspartate; ADP = adenosinediphosphate; ATP = adenosinetriphosphate; Cho = choline; Chol = cholesterol; EA = Ethanolamine; FA = fatty acid; GABA = γ-aminobutyric acid; Gln = glutamine; Glu = glutamate; Gly = glycine; GPC = glycerophosphocholine; GSH = glutathione; Lac = lactate; m-Ins = myo-inositol; NAA = N-acetylaspartate; NADH/NAD + = reduced/oxidized nicotinamide adenine dinucleotide; Phe = phenylalanine; Tau = Taurine; tCr = total creatin; Trp = tryptophan; Tyr = tyrosine; TMAO = trimethylamine N-oxide. (B) Multivariate analysis of the HRMAS NMR spectra (n = 6 per group) using orthogonal partial least square-discriminant analysis (PLS-DA) modelling (R2 = 0.998, Q2 = 0.962). (upper) Scores plots (PLS-DA1 vs PLS-DA2). The score plot explains 64% of total variance of control clustering in the positive PLS-DA2 scores, and PET in the negative PLS-DA2 scores. (lower) Loading plots of PLS-DA1 for all buckets containing assigned peaks.
|
