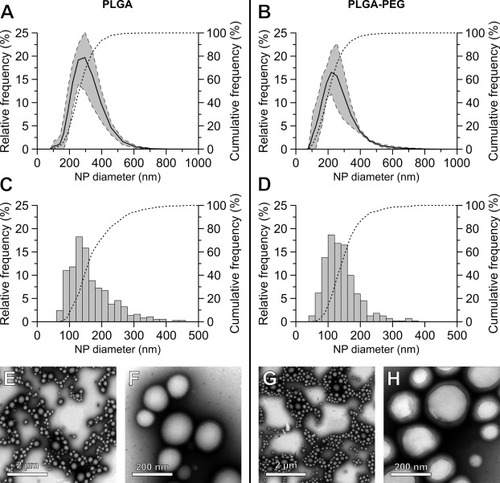
Fig. 3
|
Size distribution and morphology of CPZ-loaded PLGA and PLGA-PEG nanoparticles. (A,B): DLS measurements for the diameter of CPZ-loaded PLGA (A) and PLGA-PEG (B) nanoparticles. Each graph shows the average count-based distribution in size (d.nm) of three separate nanoparticle batches, analysed by DLS within 3 h of production. The dashed lines indicate the standard deviation and the dotted line represent the cumulative distribution. (C-H): Freshly prepared CPZ-loaded nanocarriers were stained with uranyl acetate and imaged with TEM. (C,D): Analysis of TEM images for the size distribution (d.nm) of nanoparticles made with PLGA (C) and PLGA-PEG (D). The dotted lines indicate the cumulative distribution frequency. TEM images are shown of CPZ-loaded PLGA (E,F) and PLGA-PEG (G,H). Scale bars represent either 2 µm (E,G) or 200 nm (F,H). |

