|
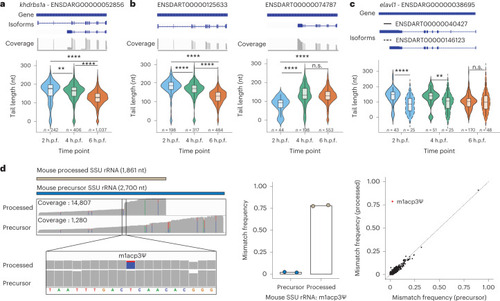
Isoform-specific polyA tail and modification dynamics can be captured using Nano3P-seq.a, Comparison of polyA tail length distributions of reads mapping to khdrbs1a, illustrated at the per-gene level, measured at three time points during the zebrafish MZT. Annotations of the gene and two main isoforms are shown at the top of the panels, along with an IGV coverage track of the reads mapping to the gene. b,c, Comparison of polyA tail length distributions of reads mapping to two distinct isoforms (full and dashed outline) of elavl1 measured at three time points during the zebrafish MZT. Annotations of the gene and two main isoforms are shown at the top of the panels. a–c, Only isoforms with more than ten reads are shown. The number of reads included in the analysis is shown below each violin plot. P values have been computed using the Kruskal–Wallis test and corrected for multiple testing using the Benjamini–Hochberg method. Box plot limits are defined by lower (bottom) and upper (top) quartiles. The bar indicates the median, and whiskers indicate ±1.5× interquartile range. d, IGV coverage tracks of reads mapping to mouse processed small subunit rRNA (top track) and precursor SSU rRNA (bottom track), including a magnified image at the position known to be modified with m1acp3Ψ (left). Reads mapping to SSU rRNAs were assigned to either ‘precursor’ or ‘processed’ isoforms on the basis of the overlap between 3′ end of the read and annotated end of the isoforms. Only reads with 3′ ends within ±10 nucleotides of the annotated end of an isoform were kept. Positions with a mismatch frequency lower than 0.1 are shown in gray. Middle, the mismatch frequency values in mouse precursor and processed SSU rRNA at the position known to be modified with m1acp3Ψ (n = 2 biological replicates) are shown. Right, the per-site mismatch frequencies observed in reads mapping to mouse precursor SSU rRNA and mouse processed SSU rRNA are compared, showing that the only outlier is m1acp3Ψ. Source data
|