|
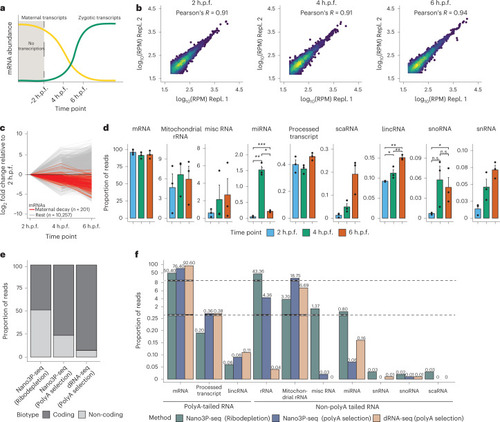
Nano3P-seq captures a wide diversity of coding and non-coding RNAs and their expression dynamics during the maternal-to-zygotic transition (MZT).a, Schematic overview of the transcriptional change that occurs during the MZT in zebrafish. b, Scatter plots depicting the correlation of mRNA log transformed RPM between biological replicates at three different time points during the MZT. c, Changes in mRNA abundance during the MZT (t = 2, 4, and 6 h.p.f.), relative to 2 h.p.f. Genes previously reported to have a ‘maternal decay mode’ are depicted in red. d, Bar plots depicting the abundance of different RNA biotypes captured by Nano3P-seq during the MZT (2, 4, and 6 h.p.f., shown in blue, green, and red, respectively). Statistical analyses were performed using the Kruskal–Wallis test. n = 3 biological replicates, data are presented as mean ± s.e.m. *P ≤ 0.05, **P ≤ 0.01, P ≤ 0.001, ****P ≤ 0.0001. n.s., not significant (P > 0.05). e, Relative proportion of coding and non-coding RNAs captured using dRNA-seq (on polyA-selected samples), Nano3P-seq (on polyA-selected samples), and Nano3P-seq (on ribodepleted samples). f, Percentage of reads mapping to distinct biotypes captured using Nano3P-seq (on ribodepleted samples) (green), Nano3P-seq (on polyA-selected samples) (blue), and dRNA-seq (on polyA-selected samples) (light brown). Source data
|