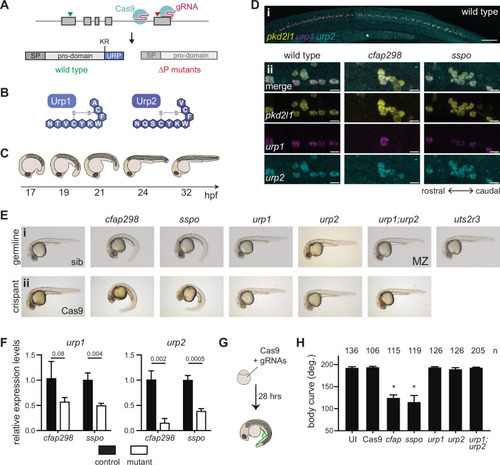
(A) urp1 and urp2 are 5-exon genes (gray boxes). The final exon codes for the 10-amino acid peptides produced after cleavage from the prodomain at a dibasic site (KR). Pairs of gRNAs were used to induce deletions of Urp1 and Urp2 peptide coding sequences, resulting in urp1∆P and urp2∆P mutants, respectively. SP – signal peptide. (B) Urp1 and Urp2 peptide sequences with identical hexacyclic regions. (C) Zebrafish posterior axial straightening, the morphogenetic process which straightens the embryonic body. (D) Fluorescence in situ hybridization based on hybridization chain reaction analysis of pkd2l1, urp1, and urp2 expression in the central canal at 28 hpf. pkd2l1 expression marks CSF-cNs. urp1 expression is restricted to ventral CSF-cNs while urp2 is expressed in all CSF-cNs. Both urp1 and urp2 are expressed in cfap298tm304 and sspob1446 mutants, though comparison of expression between samples was non-quantitative. (i) Shows the zebrafish trunk with the yolk stalk labeled (*). (ii) Shows zoomed regions taken at the rostro-caudal level at the end of the yolk stalk. Scale bars: 150 µm (i), 10 µm (ii). (E) Lateral views of 28–30 hpf germline mutants (i) and crispants (ii). The urp1∆P;urp2∆P double mutants are maternal zygotic (MZ) mutants. Sibling (sib) and Cas9-only injected embryos served as controls. All embryos were incubated at 28°C, which is a restrictive temperature for cfap298tm304. (F) Quantitative reverse transcriptase PCR (qRT-PCR) analysis of urp1 and urp2 mRNA expression levels in cfap298tm304 and sspob1446 mutants at 28 hpf. n>3 biologically independent samples. Bars represent mean ± s.e.m. Two-tailed student’s t test used to calculate p-values. (G) Schematic of crispant generation and body curve analysis. (H) Quantitation of crispant body curves where bars represent mean ± s.d. for at least three independent clutches and injection mixes. The total number of embryos analyzed is given. *p<0.0001, student’s t test applied. UI – uninjected.